

At month-end, the cost report revealed a $120,000 manufacturing overhead overrun. The workshop director noted that production volume also exceeded targets. This is common in manufacturing: costs are settled monthly while production runs daily—two different timelines only reconcile at month-end. The QSC system addresses this misalignment by breaking down operational results into three dimensions—Quality, Service, and Cost—and mapping them to a single work order, shift, and workstation.
Using a hardware workshop as an example: monthly output of 300,000 units with a standard unit cost of $18.60, broken down into materials at $12.00, labor at $3.20, and manufacturing overhead at $3.40. Below is how the full month's process unfolds.

At 7:45, the pre-shift meeting covers only three key points.
The morning meeting focuses on three key metrics: the shift's planned output, the previous shift's first-pass yield, and the previous shift's per-unit cost variance. Quality is assessed via yield rate and rejections from downstream processes; service performance is measured by on-time delivery; and cost efficiency tracks material waste, labor hours, and energy consumption. All figures are drawn directly from the prior shift's production records—not added later by Finance. Displaying these numbers visibly ensures every team member knows exactly where they stand that day.
At 8:30 AM, costs begin to accumulate at the workstation.
Mass production is allowed only after First Article Inspection passes. Work orders carry standard consumption; excess requisition requires an exception ticket, and material overconsumption is logged to the team at the time of picking. Labor costs are accumulated based on reported hours, while equipment idle time exceeding 20 minutes triggers an entry in the exception log. Cost control points shift from the finance office to the workstation; this is a prerequisite for QSC entering the workshop floor.
10:20 AM: One Rework, Three Lessons Learned
A workstation generated a batch of burrs, requiring rework for 20 units. Quality metrics track the drop in pass rate and rework hours; cost metrics capture rework materials, labor, and equipment downtime; service metrics record downstream line stoppages. All three data points point to the same incident report, which documents the responsible team, costs, root cause, and corrective actions—eliminating reliance on memory for end-of-month performance reviews.
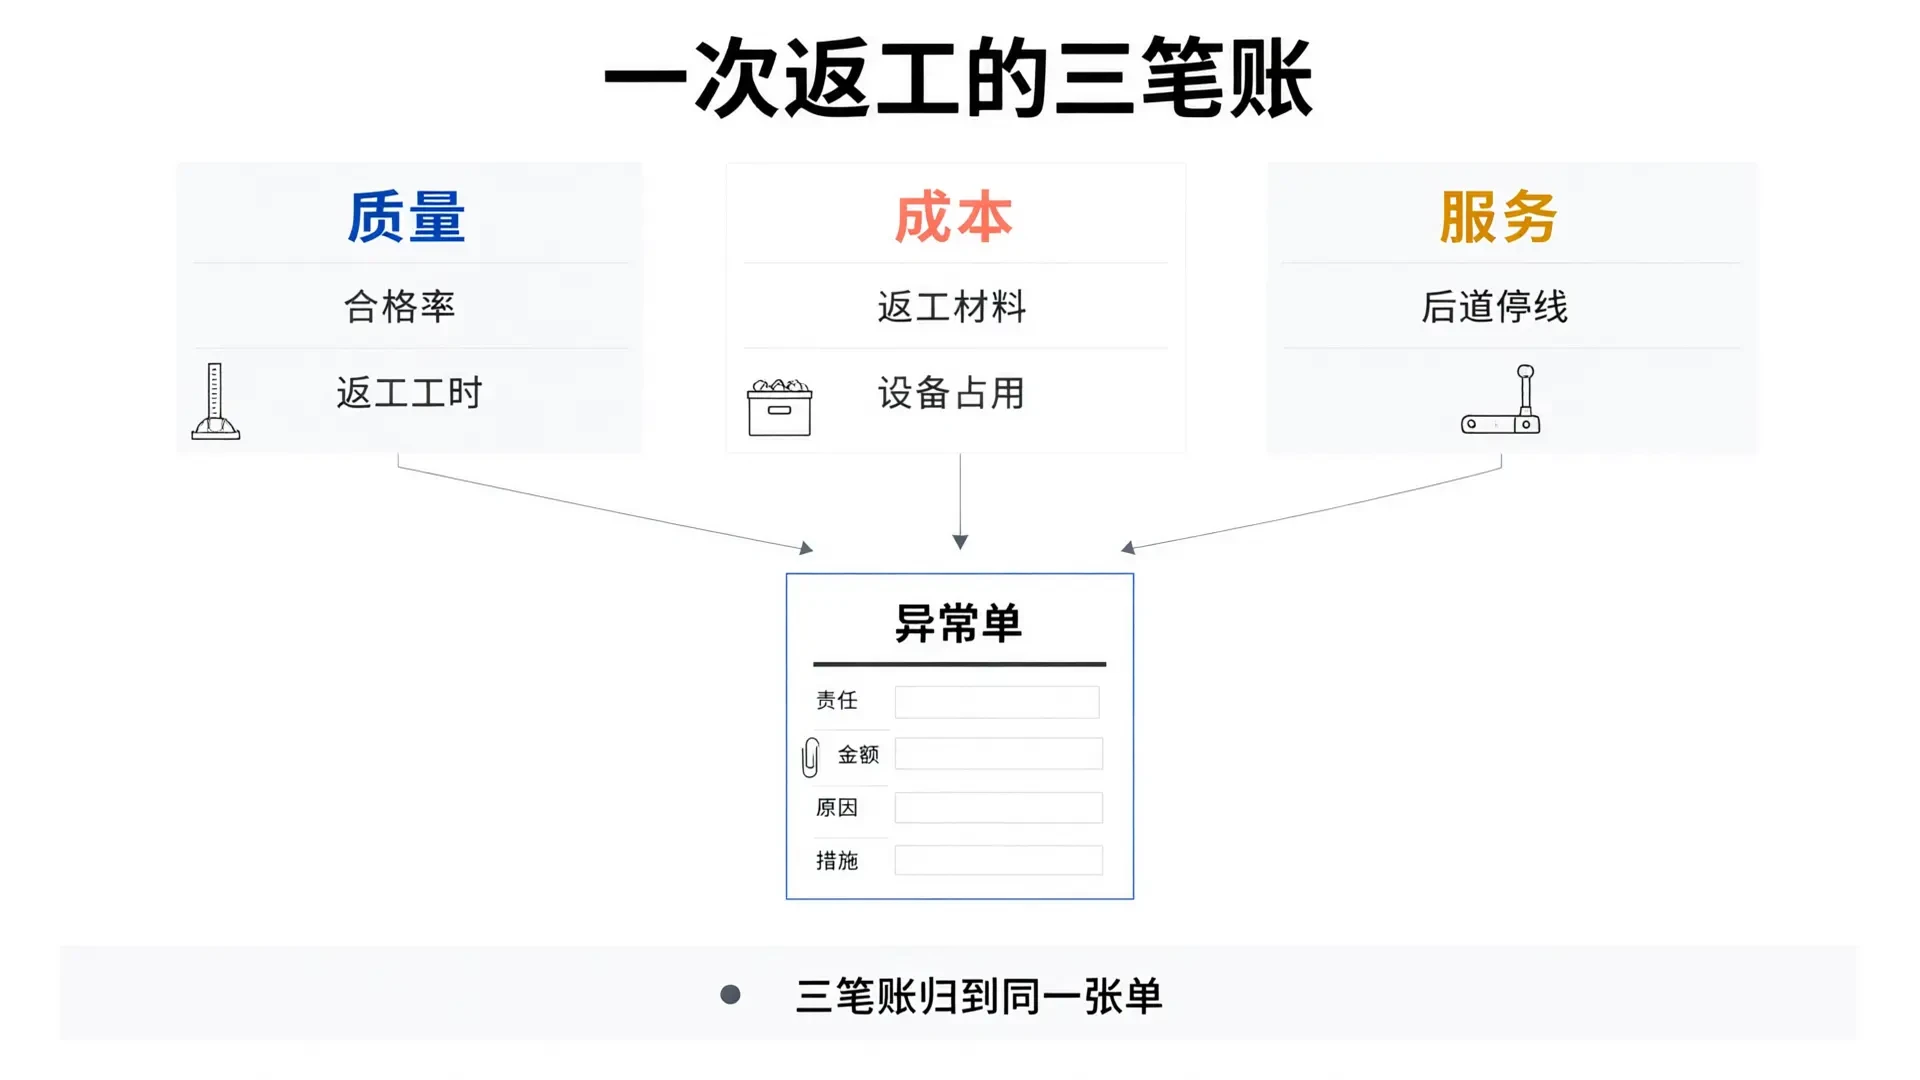
14. Handover follows internal customer acceptance criteria.
The next process must sign off for this shift's products to be considered delivered. The sign-off form tracks only three fields: quantity, accepted count, and return reason. This defines a measurable service metric: it's not about whether the attitude is good, but whether the next process has to stop to resolve issues from the previous step.
At 5:30 PM, the daily class report is settled.
Shift Report (Half-Page): Planned vs. Actual Output, First Pass Yield, Unit Cost & Variance. Variance breakdown: Materials, Labor, Overhead, and Quality Loss. Include a root cause for any variance exceeding 3%. Display report on the board daily; use directly in the next morning meeting. Shift-level costing replaces monthly closure, giving leadership a traceable cost curve down to individual workstations.
At month-end, merge the three dimensions in the performance report.
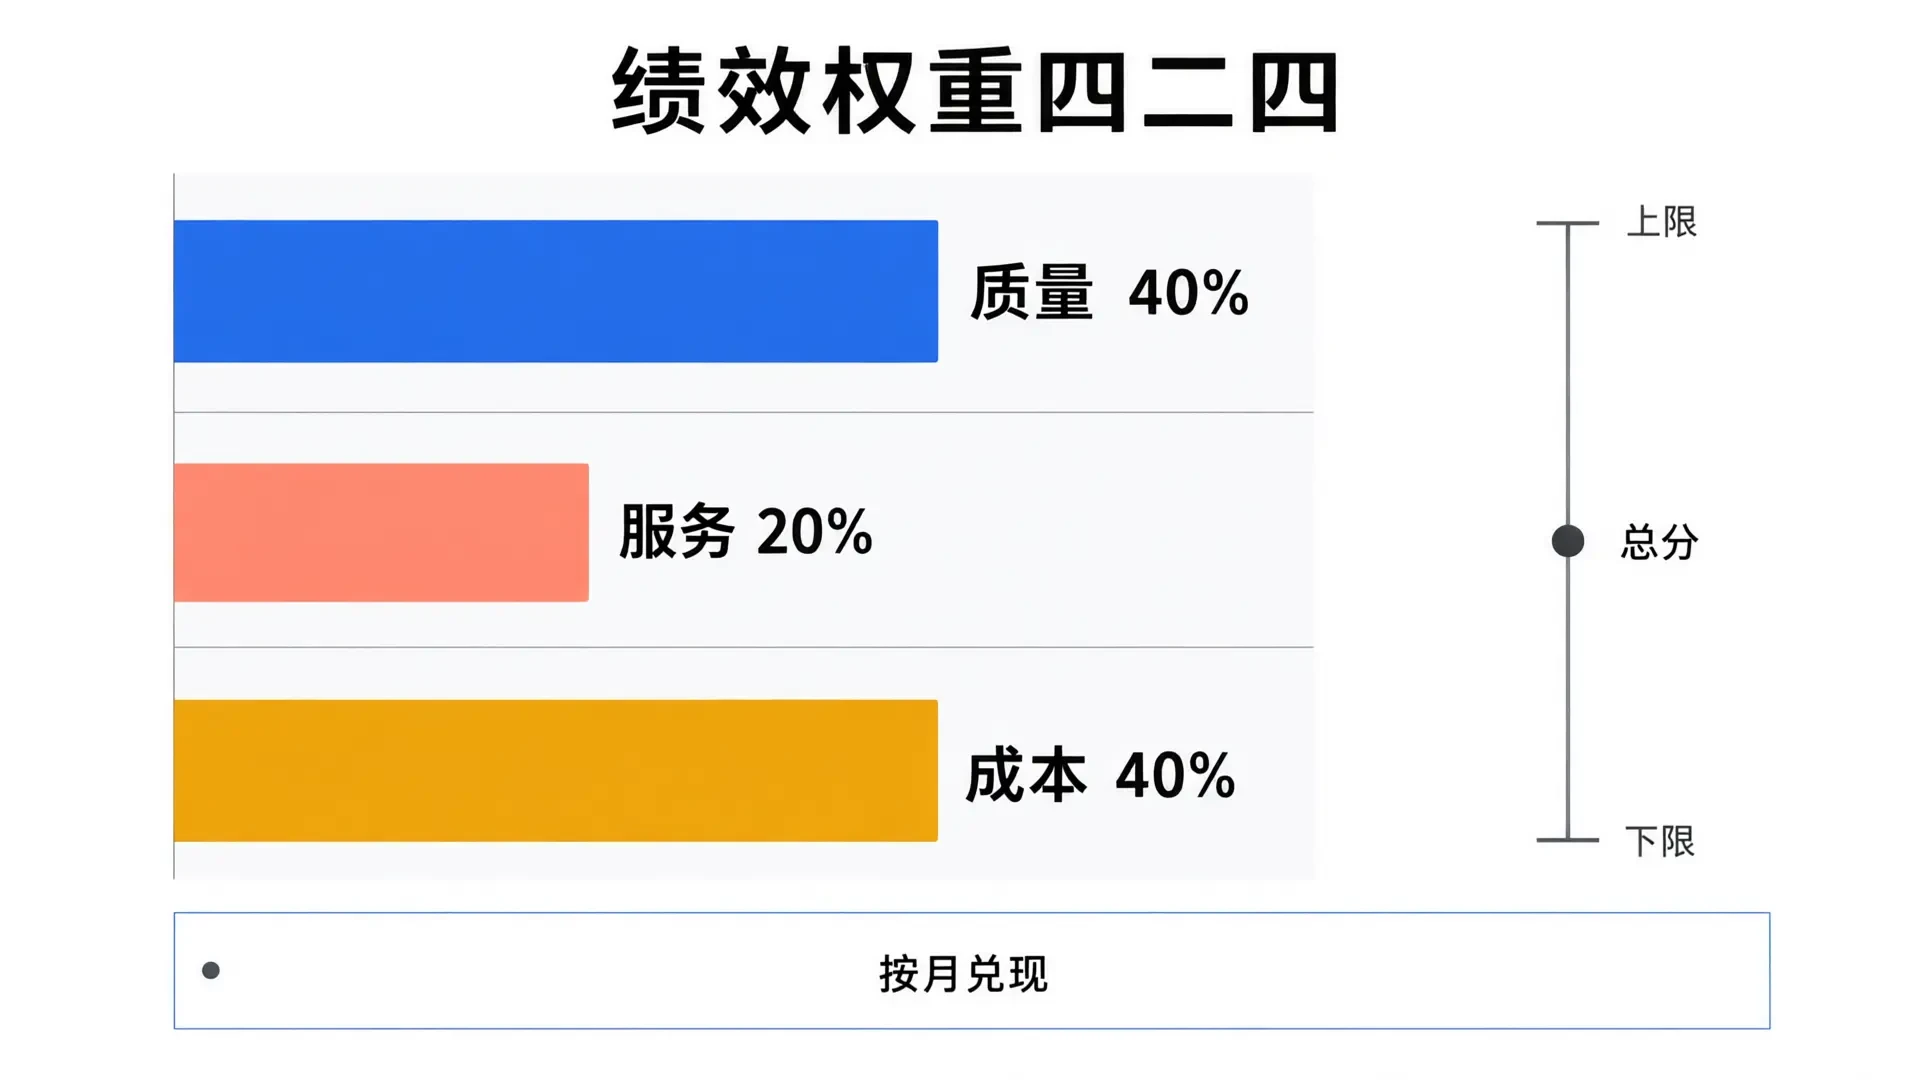
Weights are set by industry and stage. In this workshop, quality accounts for 40%, service for 20%, and cost for 40%. Quality is measured by first-pass yield and external returns; service by on-time delivery and internal returns; cost by per-unit cost variance and over-issuance rate. Each metric has defined upper and lower limits to prevent trade-offs: a 5% cost reduction paired with a 2-point drop in yield results in a lower total score. Bonuses are paid monthly based on formulas embedded in team plans.
Three common pitfalls during landing
Focusing solely on cost causes the workshop to cut inspections and push for output, leaving after-sales costs to pile up later. Inconsistent metrics—finance calculating with tax while the workshop calculates without—create mismatches that undermine trust in performance evaluations. Delayed payouts, such as quarterly bonuses paid at year-end, render incentives ineffective. The real challenge in QSC isn't managing three dimensions; it's aligning all metrics to a single work order.
The challenge in shop floor management isn't a lack of metrics, but their misalignment. The QSC system's value lies in unifying these three dimensions into a single record and performance scorecard, enabling cost control at the workstation and ensuring performance rewards keep pace with production. In our business-finance integration projects, we first standardize data definitions and work order granularity before determining weights and bonuses.