

A manufacturing company with over $100M in annual revenue shows three of its five business lines as profitable on the financial statements. Yet, at year-end, the overall net profit margin is only 2.1%, far below industry average. Where's the issue? The answer lies in a dimension many business owners overlook: seemingly profitable business lines may actually be losing money behind the scenes.
Traditional income statements aggregate revenue and costs by product or department, yielding a broad profit figure. This level of granularity is insufficient to answer a critical question: How much resource consumption, capital occupancy, and actual return does each business line generate? In our work with SME clients, we found that most operational losses stem not from obviously loss-making businesses, but from those that "appear profitable." Identifying these hidden losses requires extracting three key metrics from the profit dashboard.
Deviation Between Contribution Margin and Net Profit Margin
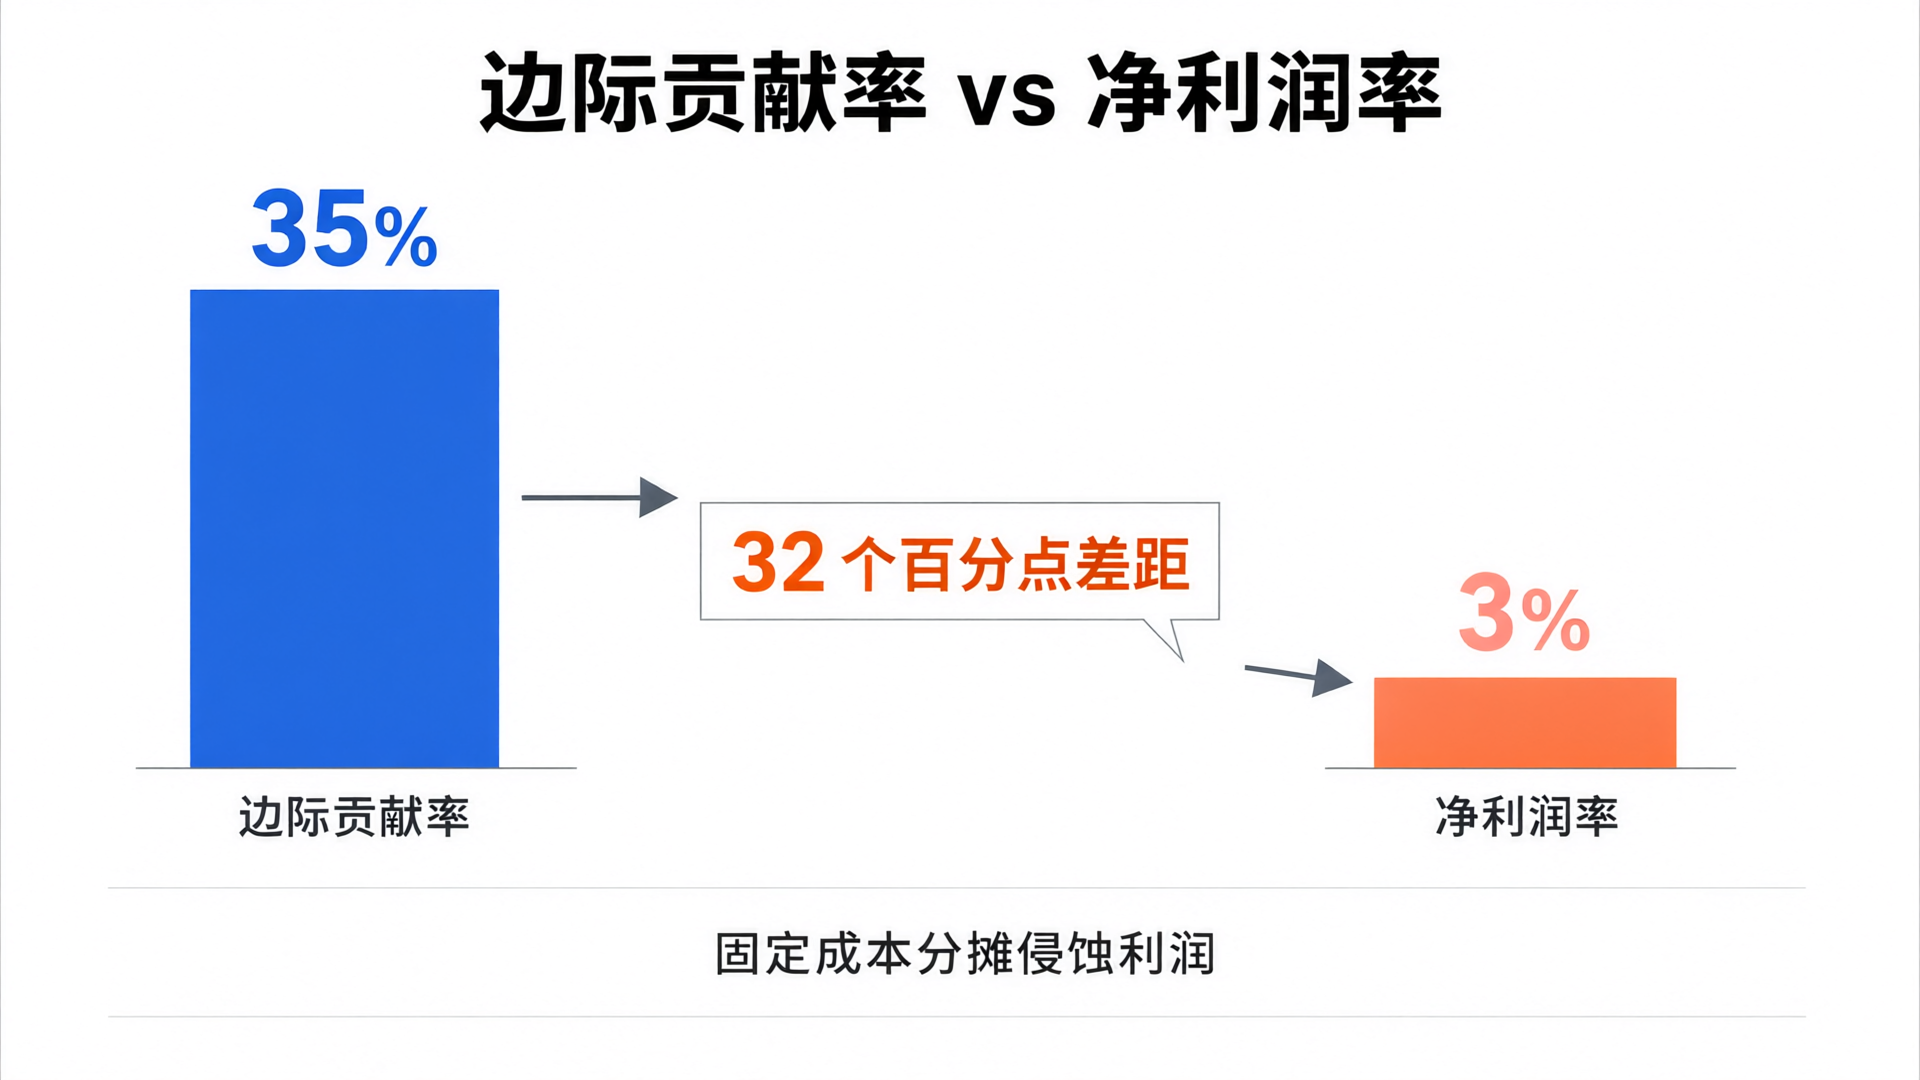
The first clue lies in the gap between contribution margin and net profit margin. Contribution margin measures how much of each dollar of revenue remains after covering direct variable costs to contribute toward fixed costs. If a business line has a contribution margin of 35% but a net profit margin of only 3%, the 32 percentage point difference represents the fixed costs and hidden expenses it consumes.
This metric distinguishes between "profitable business models." Some revenue streams are large but require dedicated teams, independent warehousing, and specialized marketing budgets. After allocating fixed costs, little remains. In our financial analysis for an e-commerce client, the managed services line showed a contribution margin of 28%. While this appeared healthy, it absorbed 40% of corporate management expenses and 35% of warehousing and logistics costs, resulting in a net loss. The greater this deviation, the heavier the consumption of fixed resources by that business line; any revenue fluctuation would immediately trigger losses.
The criterion is straightforward: if the gap between a business line's contribution margin and net profit margin exceeds 20 percentage points, review the reasonableness of its fixed cost allocation.
Days Sales Outstanding and Cost of Capital Tied Up
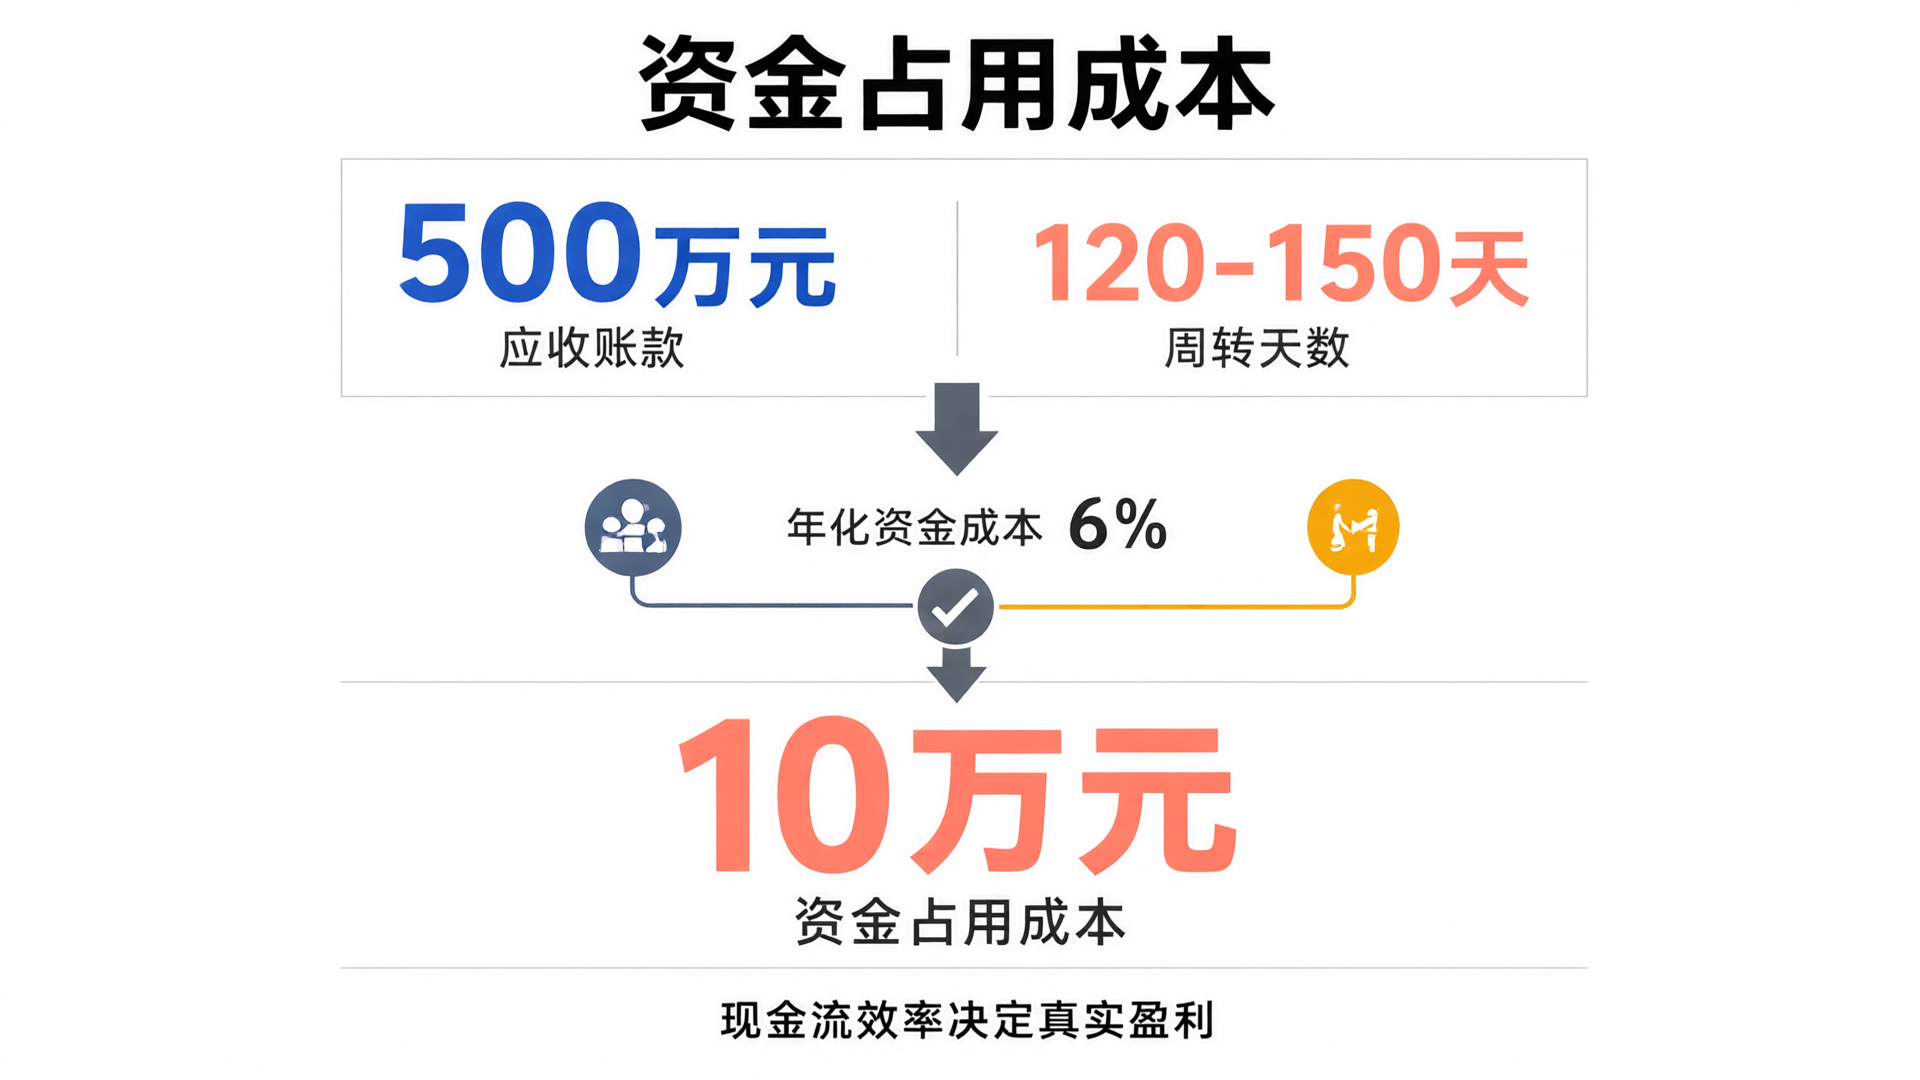
The second clue lies in cash flow. A business line may show healthy profits on paper, but if customers take 120 days or more to pay, the company is effectively funding their operations with its own working capital. Capital has a cost: at an annualized weighted cost of 6%, an accounts receivable balance of ¥500 million with a collection period of 120 days incurs an estimated financing cost of ¥10 million. This cost doesn't appear on the income statement, yet it erodes real enterprise value.
We discovered that for a manufacturing client, its largest customer accounted for 30% of revenue but had an average collection period of 150 days, while the net profit margin for the corresponding business line was only 5%. After deducting capital occupancy costs, the actual return on this business line approached zero. Business owners often focus on income statement figures but overlook how slow capital turnover dilutes true profitability.
When a business line's days sales outstanding (DSO) is significantly higher than the company average and its net profit margin fails to cover the cost of capital tied up, that line is effectively depleting the company's cash reserves.
Mismatch between resource consumption ratio and revenue contribution ratio
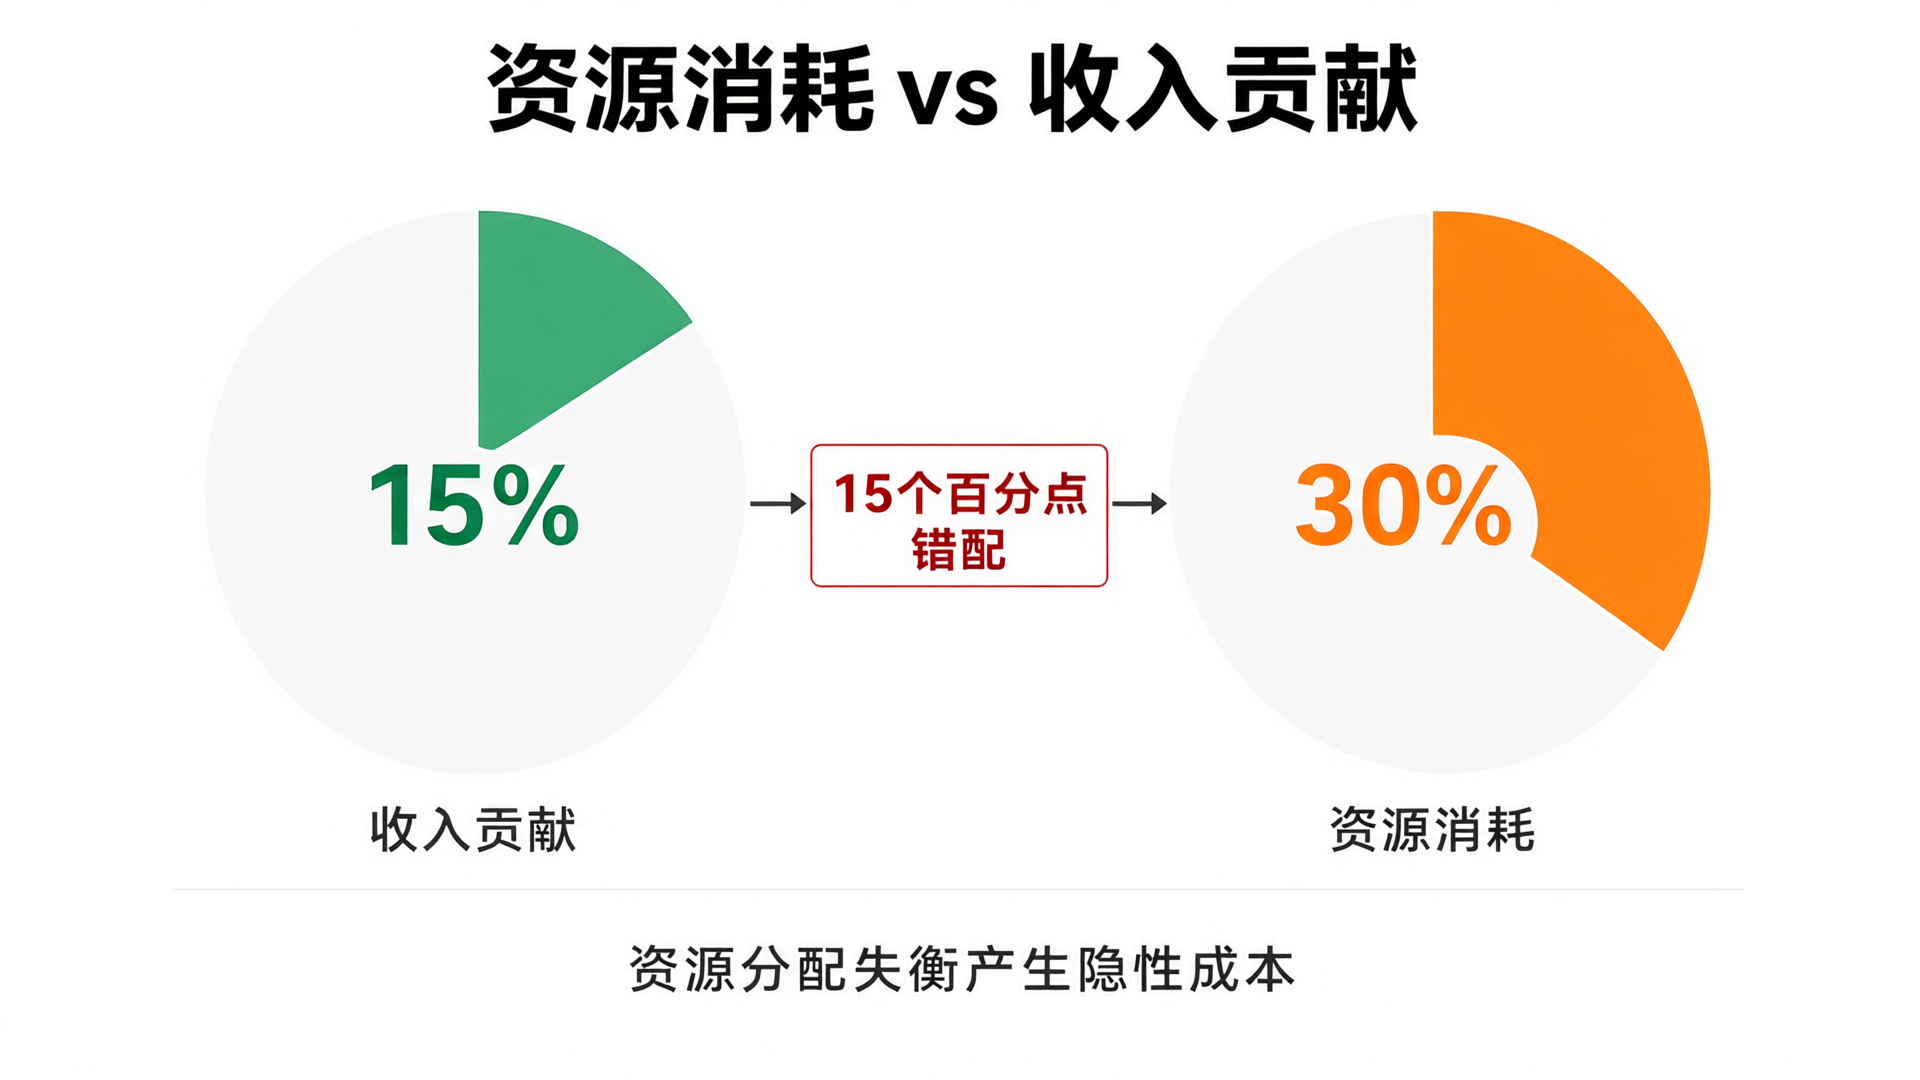
The third clue is a structural imbalance in resource allocation. Every business line consumes human resources, management attention, supply chain capacity, and channel investment, yet these consumption ratios often diverge from their revenue contribution. A business line representing 15% of revenue that consumes 30% of core engineering hours and 25% of executive decision time carries a true cost far exceeding its book value.
This mismatch is especially common among diversified small and medium-sized enterprises. To support strategic positioning or maintain client relationships, owners often retain several "me-too" business lines that neither lose money nor grow, yet continuously drain limited operational resources. During a quadrant analysis for a service-sector client, we found their value-added services accounted for only 8% of revenue but consumed the full-time effort of two employees and nearly one-third of all customer complaint-handling time. When these hidden resource costs are converted to market labor rates, this line operates at a loss.
Detecting this mismatch requires a quantitative tracking mechanism for resource consumption. When a business line's resource consumption ratio consistently exceeds its revenue contribution ratio by more than 10 percentage points, its strategic value must be evaluated to determine if it justifies the economic cost.
From Metrics to Decisions
These three metrics are not isolated. The contribution margin ratio reveals the rationality of your cost structure, the accounts receivable turnover days reflect capital efficiency, and the resource consumption ratio exposes imbalances in resource allocation. Together, they paint a more authentic picture of business performance than a traditional income statement.
The Profit Dashboard for Owner's Value Reporting is designed specifically to meet these analytical needs. It consolidates data from financial, operational, and management systems into a unified set of comparable metrics, enabling business owners to move from "feeling something is wrong" to "precisely identifying the root cause." Identifying hidden losses is not the end goal; the ultimate value of business analysis lies in using those insights to make decisions on resource reallocation, business line optimization, or strategic exit.