
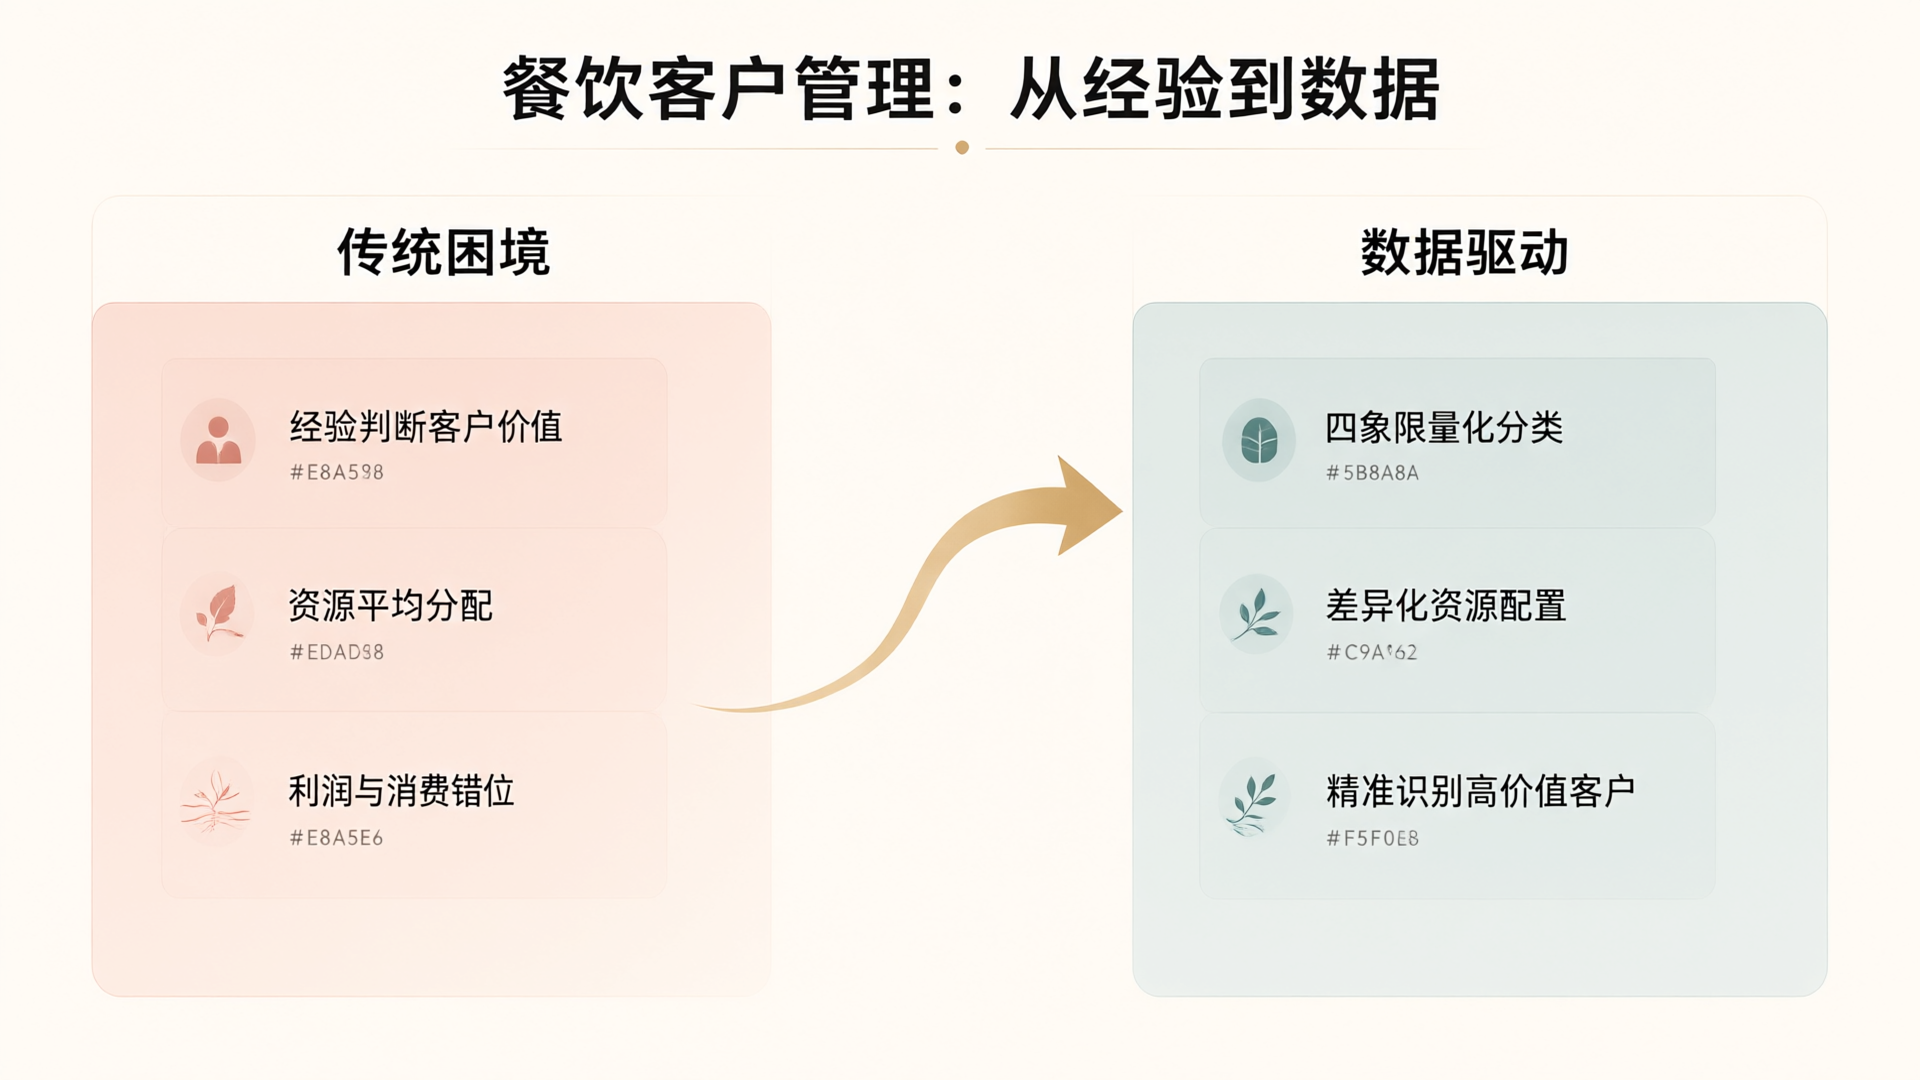
A mid-sized restaurant with annual revenue of 800 ten thousand often has more than 3000 customers with purchase records. However, the portion that truly drives profit may be less than 20%. The issue is that most operators distribute their efforts evenly across all customers: high-value clients don't receive differentiated service, while low-value ones consume disproportionate resources. The Customer Quadrant Analysis tool transforms this vague intuition into a quantifiable decision framework.
Structural Challenges in Restaurant Customer Management
Customer management in the restaurant industry has long relied on experience. Owners remember regulars' preferences, and store managers can identify frequent visitors—but "frequent visits" don't always equal "profitability." A customer who dines twice a week may contribute far less profit than a business client who visits once a month but orders high-margin beverage packages.
This misalignment has become especially pronounced as industry profits continue to shrink. In 2024, the average net profit margin in the restaurant sector dropped to around 8%, while labor, ingredient, and rent costs continued to rise rigidly.粗放式的 customer retention strategies—such as sending promotional offers to all membership groups and offering uniform compensation for every complaint—are eroding already thin profit margins.
From a managerial accounting perspective, customers should be viewed as an asset portfolio. Just as product portfolios distinguish between stars and dogs, customer segments also exhibit value stratification. The Customer Quadrant Analysis tool is designed based on this logic.
Core logic of the quadrant model
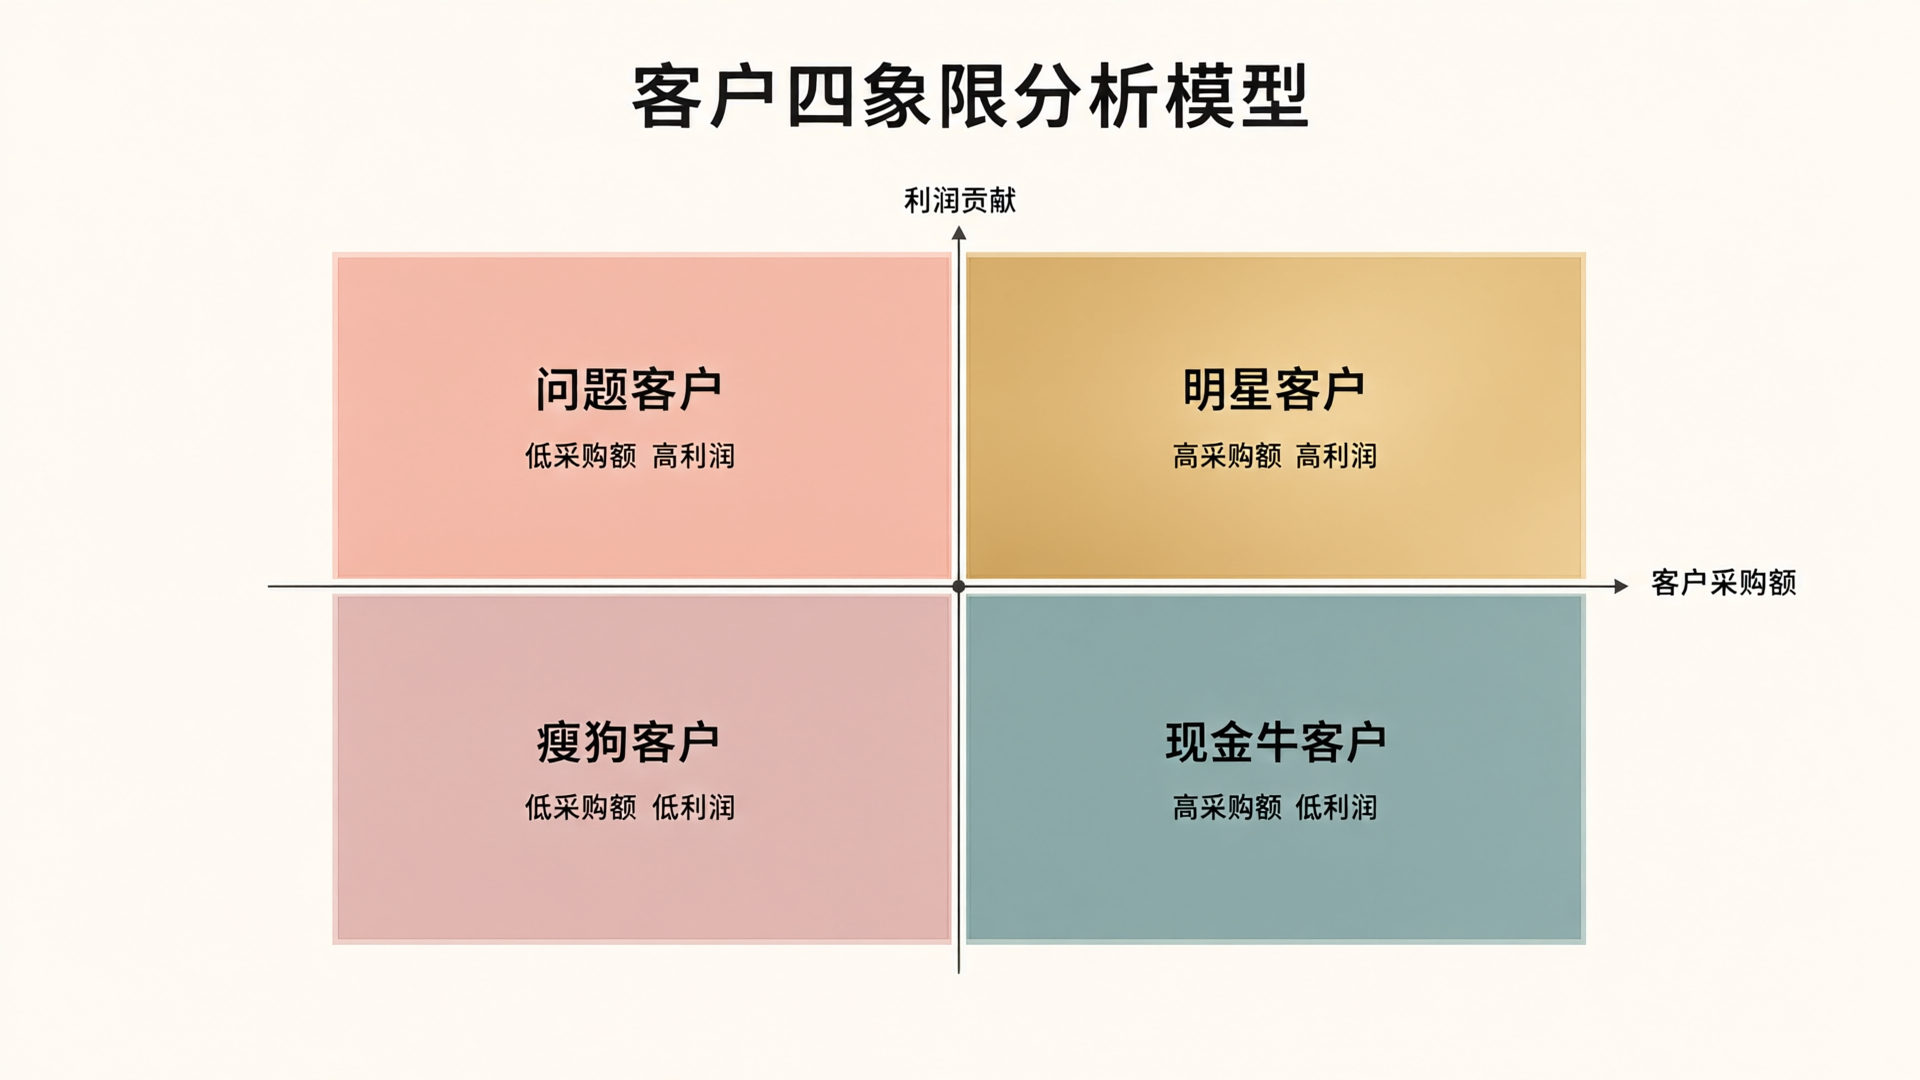
The Customer Quadrant Analysis builds a coordinate system using two dimensions. The horizontal axis represents customer purchase volume, corresponding to spending amount or frequency in the food service context. The vertical axis represents profit contribution—the marginal profit generated by the customer after deducting direct variable costs from revenue. Their intersection creates four quadrants, each defining a specific customer profile and its corresponding resource allocation strategy.
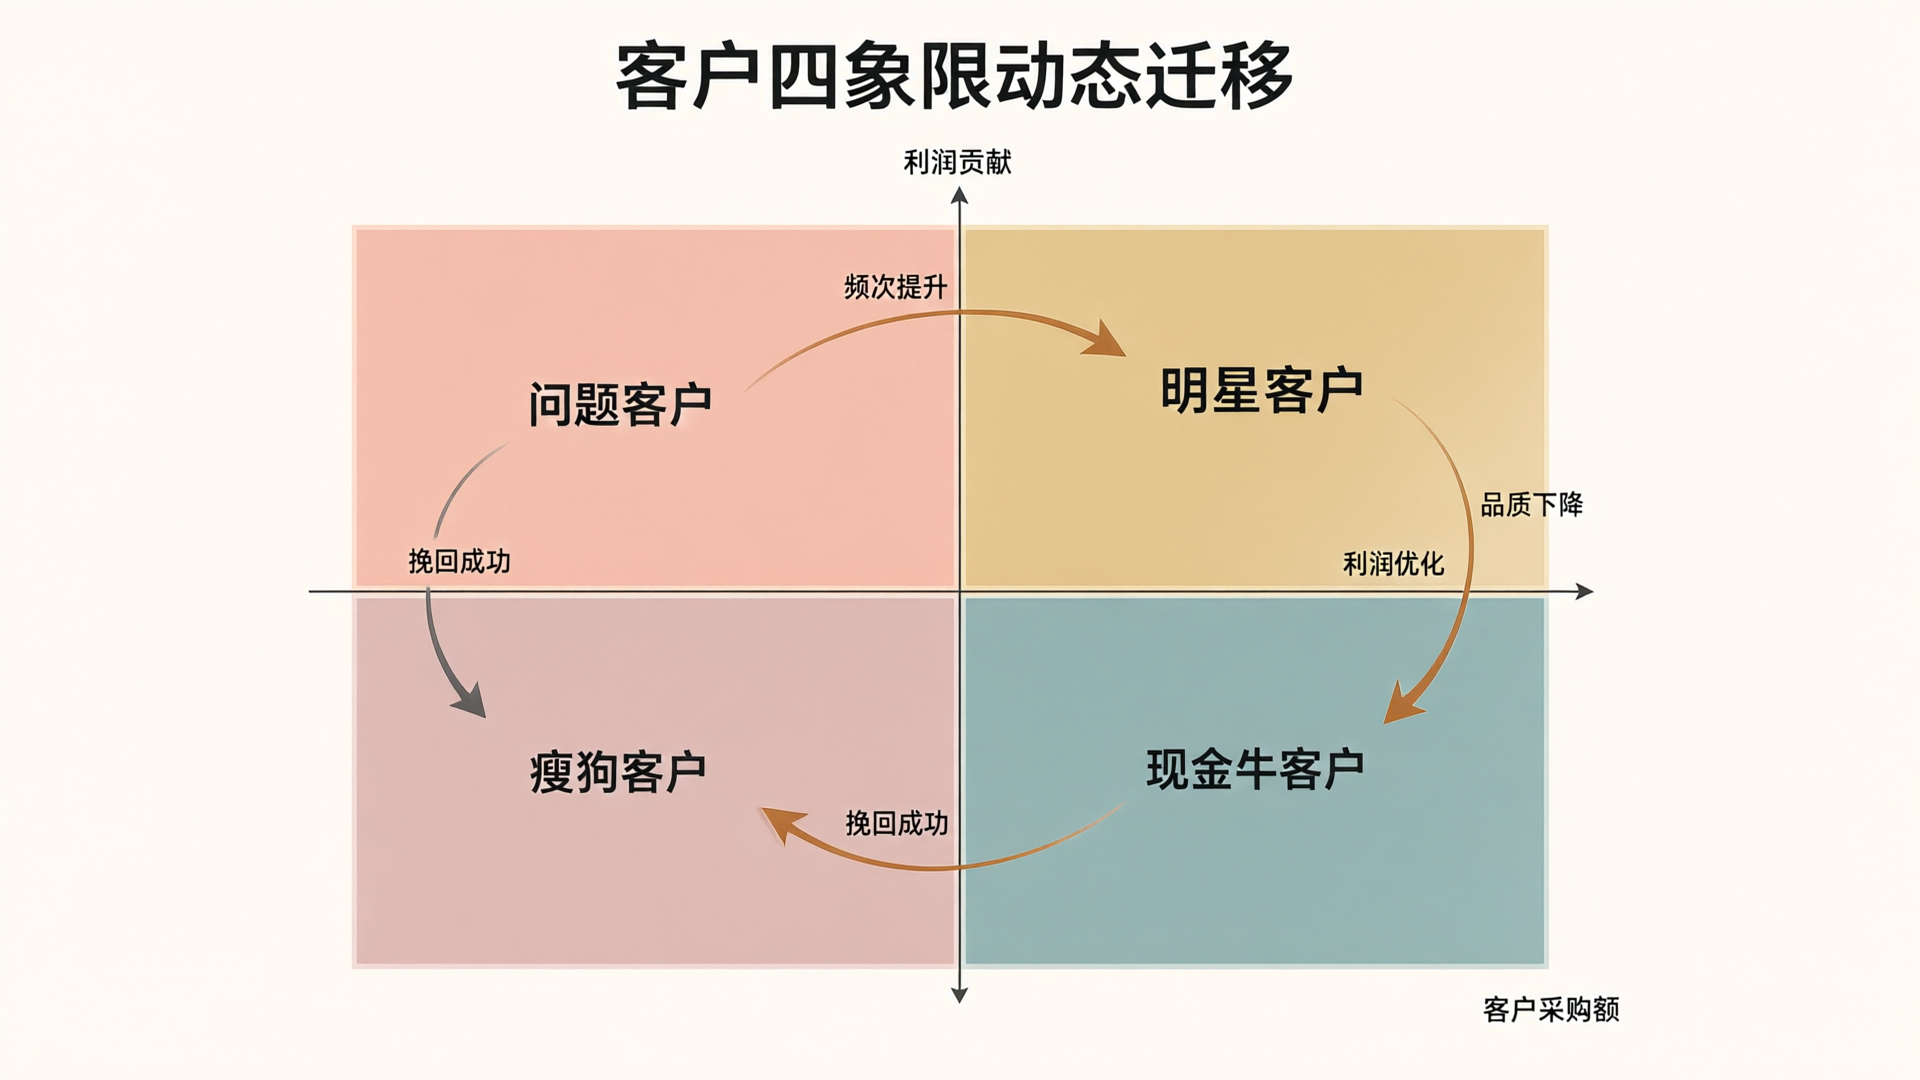
The first quadrant represents high-spending, high-profit customers classified as "Star Customers." These customers make frequent purchases with high average order values and are less price-sensitive, willing to pay a premium for quality and service. In the dining sector, they include business owners hosting regular corporate meals, food enthusiasts who demand high-quality ingredients, or groups booking entire venues for events.
The second quadrant includes high-spending, low-profit customers, classified as "Cash Cow Customers." While they drive significant revenue and store traffic, their actual profit contribution is limited due to frequent use of discounts, group buys, or ordering only low-margin menu items. These customers support the business's scale and popularity but yield thin margins per transaction.
The third quadrant comprises low-purchase, high-profit customers classified as "Problem Customers." While they shop infrequently, their average order value and gross margin per transaction are high. Their potential lies in increasing purchase frequency; once achieved, they can be transformed into Star Customers.
The fourth quadrant represents customers with low purchase volume and low profit contribution, classified as "Dogs." They exhibit low purchase frequency, low average order value, and minimal profit contribution, yet may incur disproportionately high maintenance costs—such as frequent complaints, special service requests, or excessive time spent on communication.
Data Collection and Classification for Restaurant Scenarios
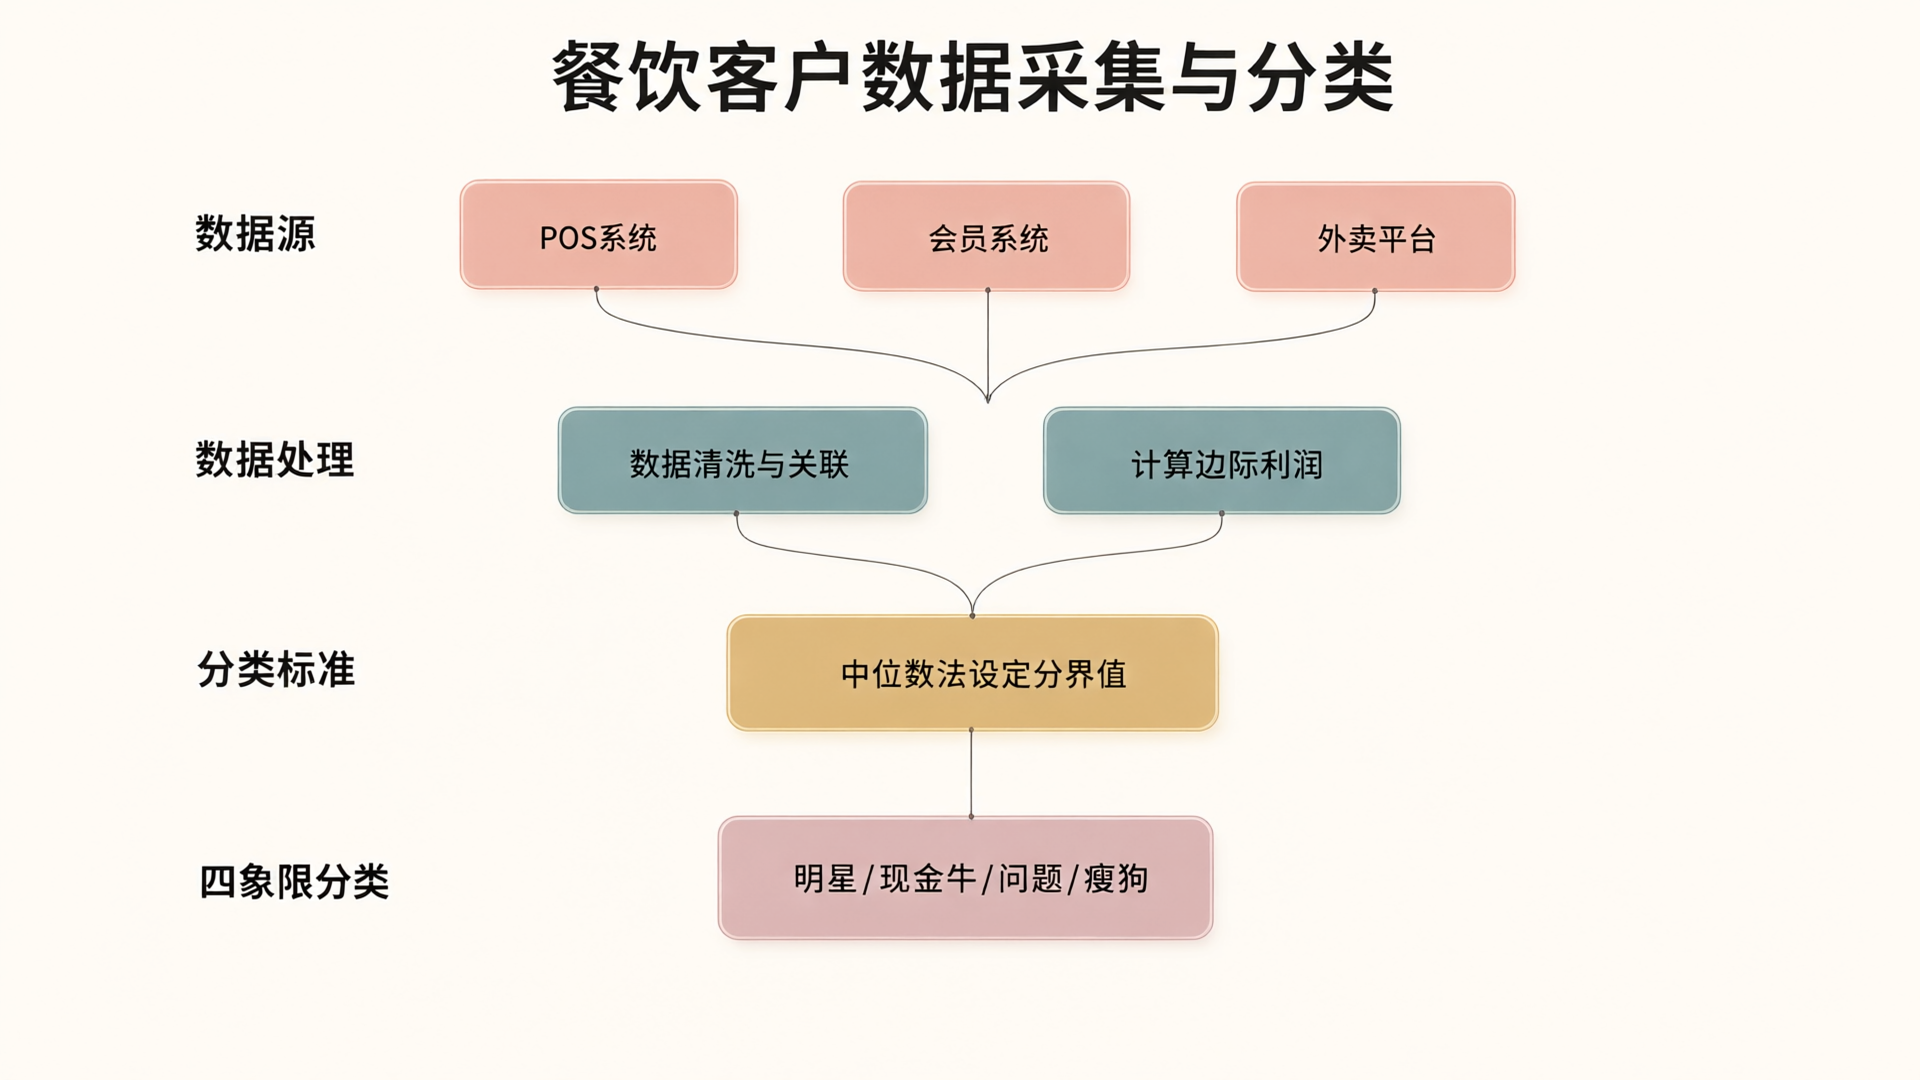
Quadrant analysis relies on data. For restaurant businesses, channels to collect customer spending data are well-established: POS systems record transaction amounts and item details; membership systems track purchase frequency and point changes; food delivery platforms capture online order customer profiles. Once these data sources are cleaned and linked, you can calculate each customer's total spend and profit contribution.
Calculating profit contribution requires dish cost data. Ingredient costs, packaging costs (for delivery), and platform commissions (for online channels) are all traceable variable costs. By aggregating a customer's orders and deducting the corresponding variable costs, you can determine that customer's marginal profit contribution. Fixed costs such as rent and labor are excluded from customer-level profit calculations, as they do not fluctuate with individual customer spending.
In practice, thresholds must be set for both purchase volume and profit contribution. There are two common methods to determine these thresholds: 1) use the median to split customers into high and low groups; or 2) use the average, though this can be skewed by outliers. The median method is more robust and is recommended for restaurant businesses with over 500 customers.
Differentiated Resource Allocation for Four Customer Segments
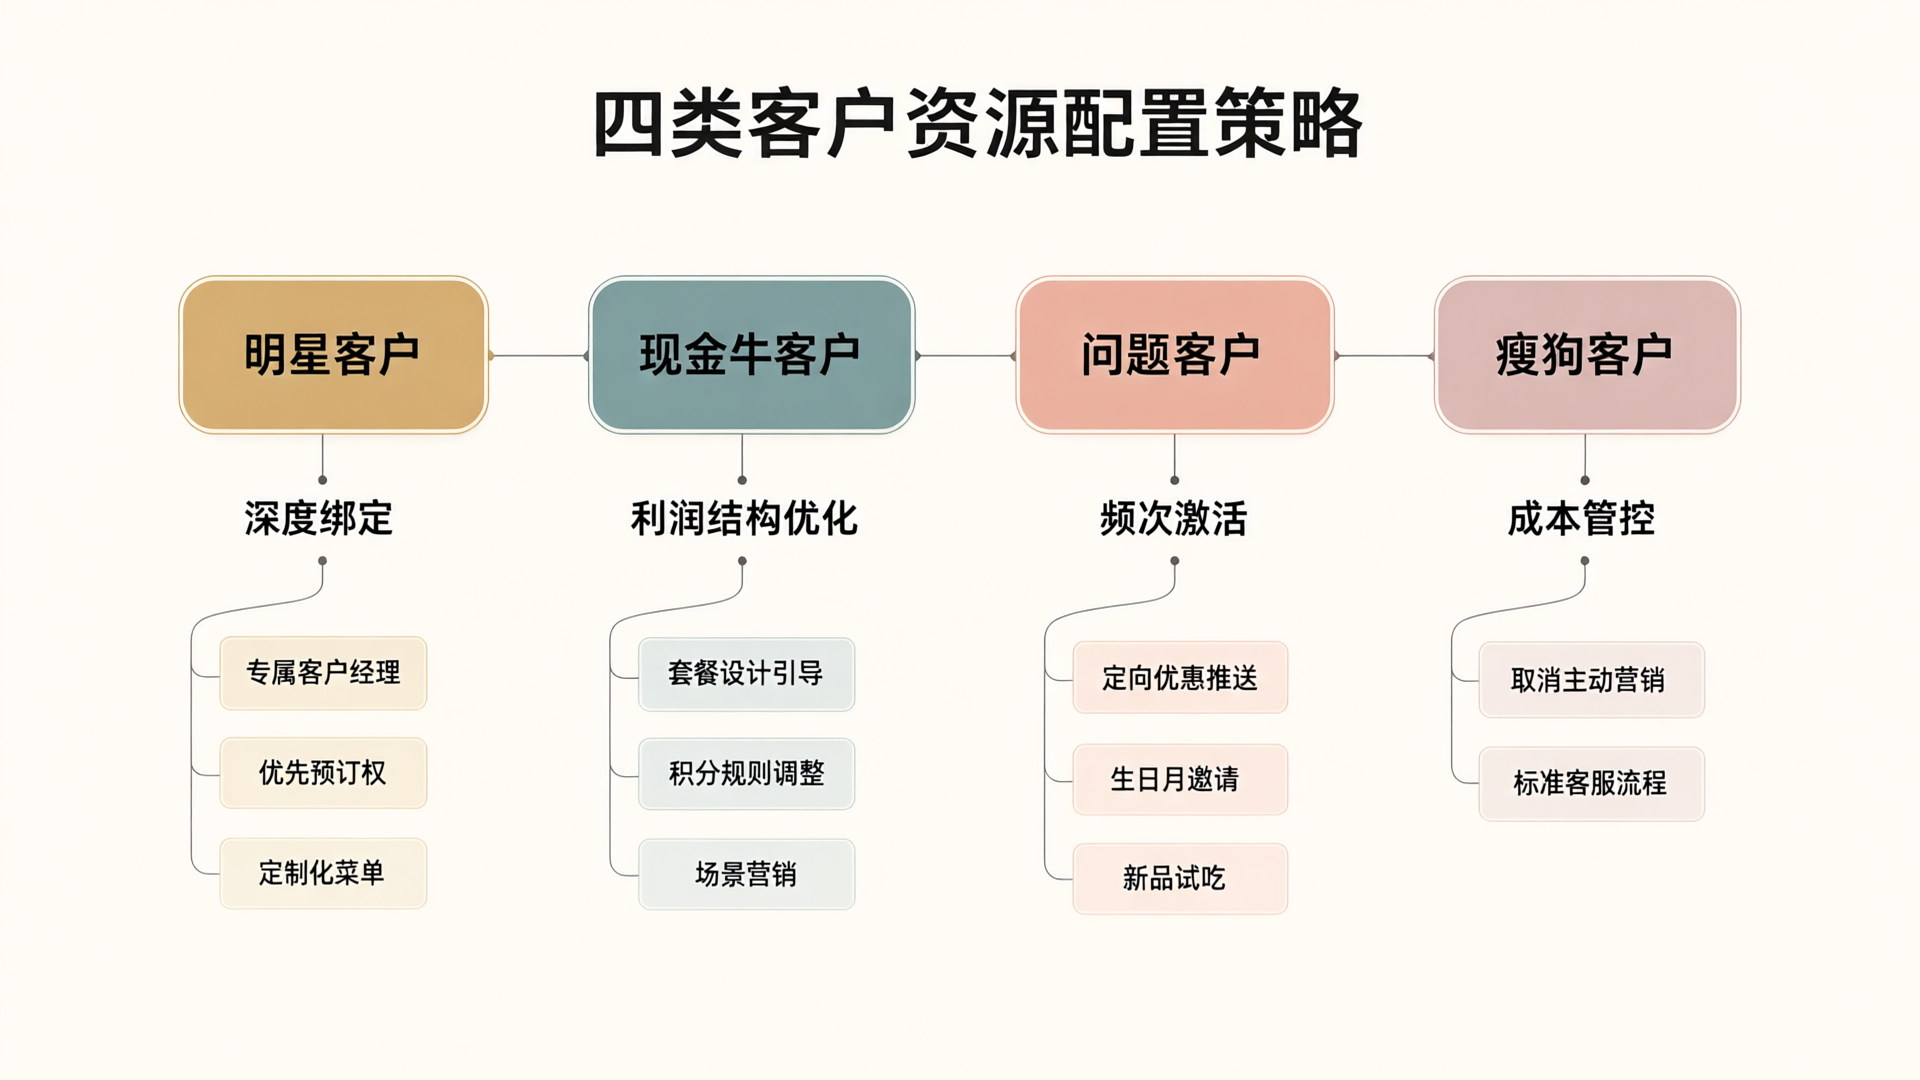
The core of resource allocation for celebrity clients is "deep integration." These clients deliver value beyond immediate profits through word-of-mouth promotion and stable repeat business. Resource investments include: dedicated account managers, priority reservation access, customized menu services, and exclusive holiday perks. For a Chinese restaurant serving business clientele, actions like creating a private WeChat group for celebrity clients, sending advance notifications of seasonal menus, and reserving fixed private rooms incur minimal marginal costs while significantly boosting client loyalty.
For cash cow customers, the core of resource allocation is optimizing the profit structure. Since their spending habits are established, directly raising prices or cutting discounts risks churn. A more effective strategy is to adjust their consumption mix: use menu design to encourage trying high-margin items; tweak loyalty point rules to shift discounts toward high-profit categories; and leverage scenario-based marketing (e.g., weekday evening specials) to drive traffic during off-peak hours. The goal is to maintain total spend while increasing unit profitability.
The core of resource allocation for problematic customers is "frequency activation." These customers have proven willing to pay for quality; their bottleneck is low purchase frequency. The focus should be on reducing the decision cost for repeat visits: targeted promotions in their preferred categories, exclusive birthday-month invitations, and new product tasting opportunities. A customer who visits once a month spending 800 per visit can double their annual profit contribution if increased to once every two months.
Resource allocation for "Dog" customers centers on cost control. This does not mean abandoning them, but rather halting additional maintenance investments. Eliminate proactive marketing efforts for these clients, adjust customer service responses to standard procedures instead of prioritizing them, and reallocate the saved resources to maintaining the top three customer segments. A key distinction: if a client currently falls into the Dog quadrant but was previously high-value, analyze the reasons for their decline to assess whether there is potential for recovery.
Dynamic Management and Regular Reviews
The customer quadrant model is not a one-time classification but a dynamic management tool. Customer spending behavior evolves over time: star customers may slip into the cash cow quadrant after a poor service experience (continuing to purchase but no longer paying a premium), while problem customers can rise to become star customers following a successful activation campaign.
We recommend that restaurants update their customer quadrant data quarterly. Updating too frequently (e.g., monthly) causes excessive classification volatility, undermining strategic guidance; updating too infrequently (e.g., annually) fails to capture changes in customer behavior. A quarterly schedule aligns with the industry's seasonal trends and supports quarterly business review meetings at each location.
After each update, monitor the direction and scale of migration between quadrants. A large influx of "Star" customers moving to the "Cash Cow" quadrant within two quarters indicates systemic issues with store quality or service. Conversely, a sustained expansion of the "Dog" quadrant suggests declining quality in new customer acquisition. These signals offer greater management value than static quarterly distributions.
From analysis to execution
The value of customer quadrant analysis ultimately drives business decisions. Resource allocation adjustments require coordination across front-of-house, kitchen, and marketing functions. Front-of-house must identify "Star" quadrant customers to deliver differentiated service; the kitchen must adjust the menu mix based on quadrant distribution to ensure stable supply of high-margin items; and marketing must design distinct outreach strategies tailored to each quadrant's characteristics.
Hongzhu Management Accounting's Customer Quadrant Analysis tool automatically segments customers based on purchase volume and profitability, helping restaurants quickly identify the distribution and migration trends of four customer types. This solution lowers the technical barrier to data analysis, enabling restaurant businesses without dedicated finance teams to perform customer value segmentation. While it doesn't replace business decisions, its structured perspective shifts decision-making from "guessing who matters" to "proving who matters with data."
In the restaurant industry, competition has shifted from "who cooks best" to "who operates most efficiently." Customer Quadrant Analysis doesn't solve menu development or supply chain challenges, but it addresses a more fundamental question: where should limited resources be allocated? The answer determines the efficiency ceiling for all other operational decisions.