
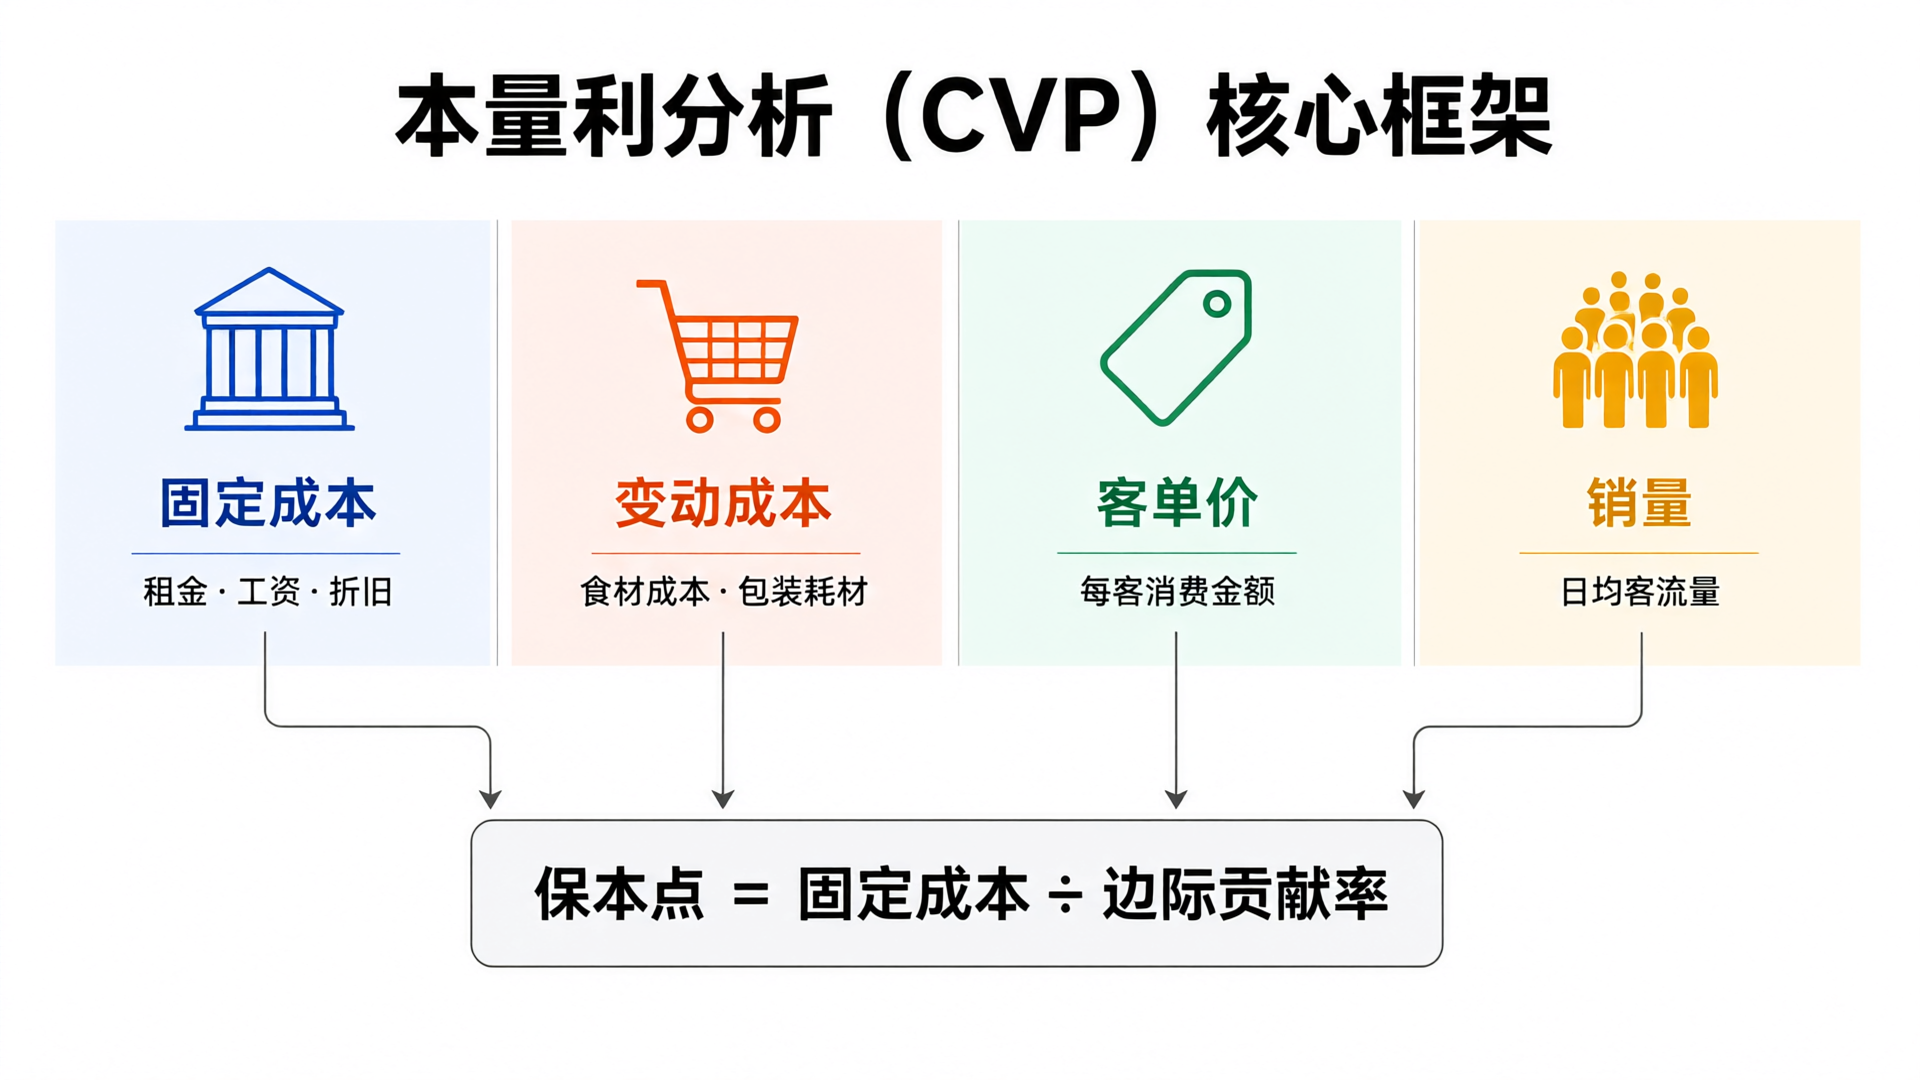
The restaurant industry is a classic "high fixed cost, high variable cost" sector. Rent, labor, and equipment depreciation represent rigid expenses, while food costs fluctuate in sync with revenue. Many operators rely on intuition to gauge performance but struggle to answer one critical question: How much monthly revenue is needed to break even? Cost-Volume-Profit (CVP) analysis is the management accounting tool designed to solve this. Using a small fast-food outlet as an example, we demonstrate the full calculation process and extract actionable insights for business decisions.
Build Model: Break Down Cost Structure
The premise of Cost-Volume-Profit analysis is to classify all costs into fixed and variable categories. Fixed costs remain constant regardless of revenue, including rent, salaries, equipment depreciation, and property management fees. Variable costs scale directly with revenue; in the food service industry, this primarily includes ingredient costs, with some packaging and consumables also categorized here.
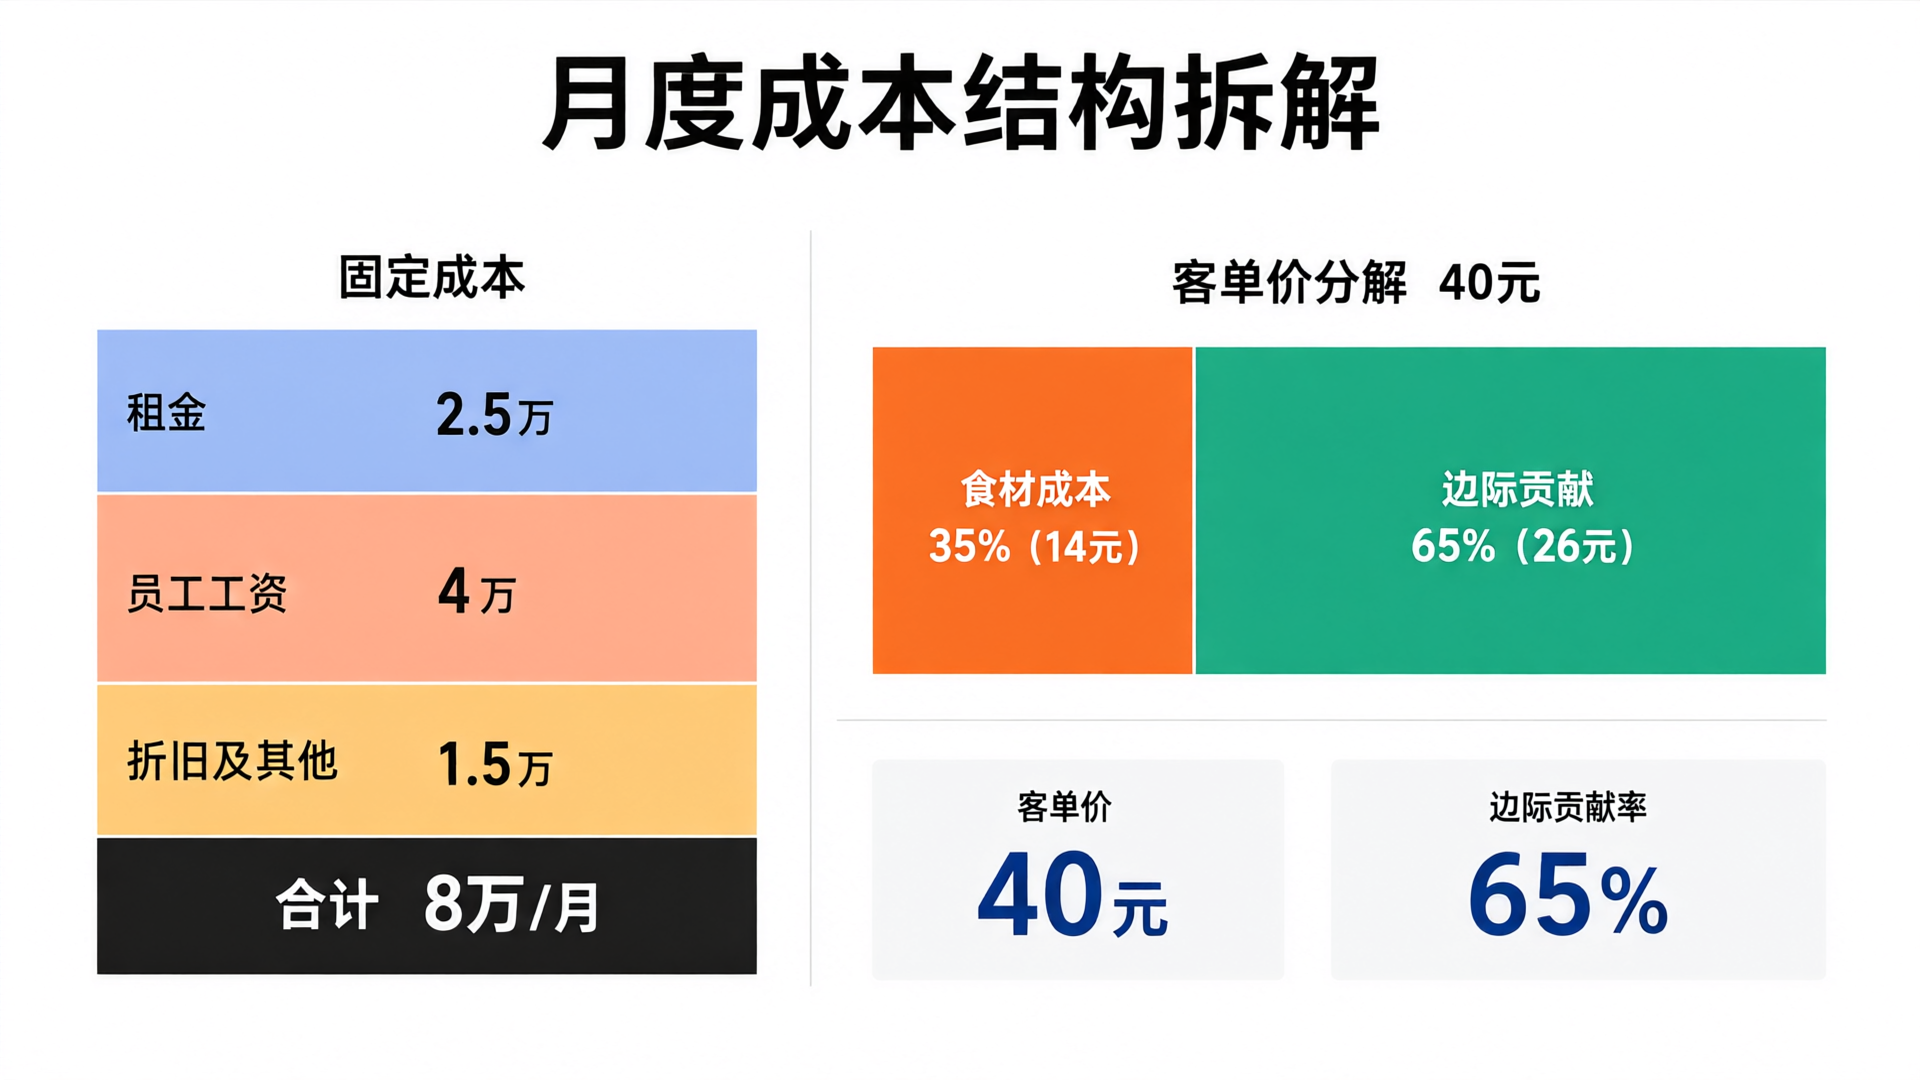
Assuming a 120-sqm community fast-food restaurant, the monthly cost structure is as follows: Total fixed costs are ¥8K, including rent of ¥2.5K, employee fixed salaries of ¥4K, and equipment depreciation plus other fixed expenses of ¥1.5K. Average order value is ¥40. Food cost ratio is 35%, meaning for every ¥40 meal sold, the food cost is ¥14. The contribution margin (amount contributed to fixed costs and profit per meal after deducting variable costs) is ¥26, with a contribution margin ratio of 65%.
Break-even Analysis: From Revenue to Customer Traffic
The break-even point is calculated as: Break-even Revenue = Fixed Costs ÷ Contribution Margin Ratio. Substituting the given values, Break-even Revenue = 80,000 ÷ 0.65 ≈ 123,077 yuan/month, which averages to approximately 4,103 yuan/day. With an average order value of 40 yuan, you need to serve about 103 customers daily to break even.
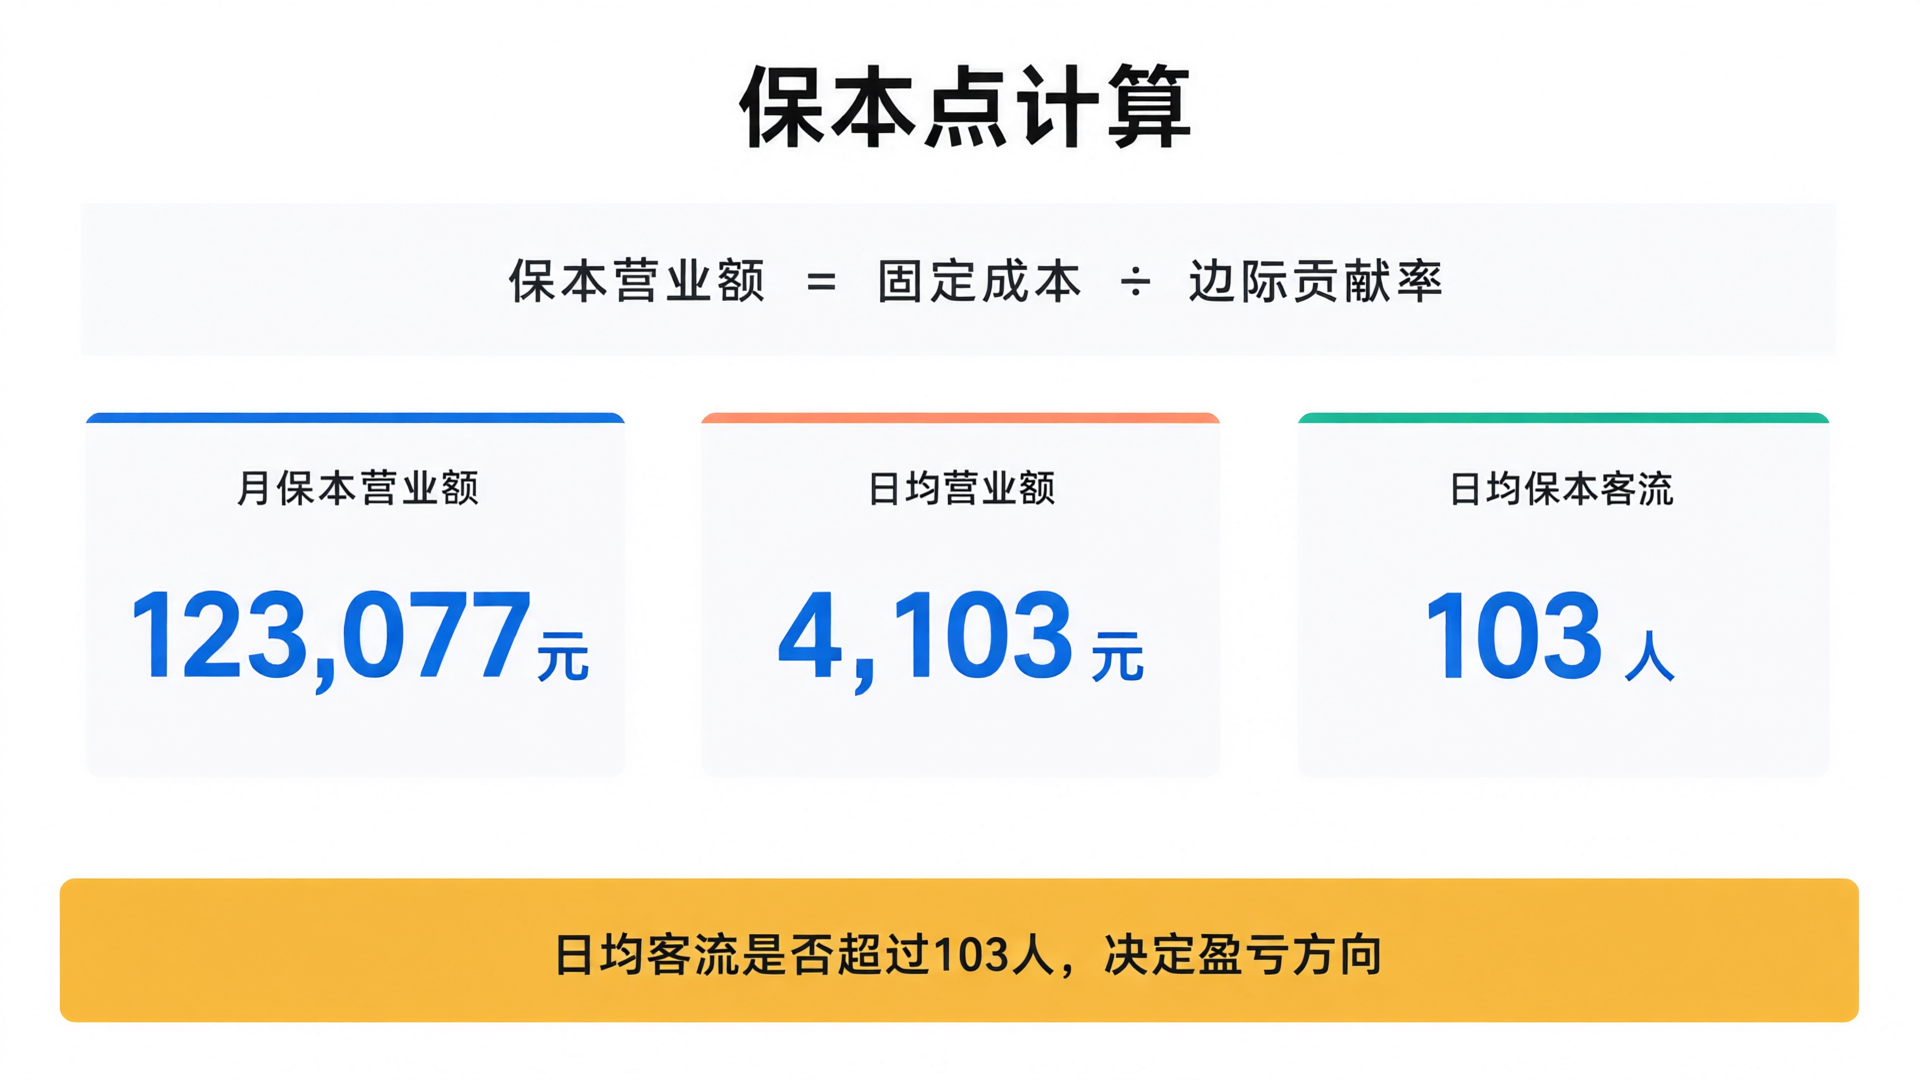
This number establishes a clear threshold for operators. Whether daily foot traffic exceeds 103 determines if the store is in the profit or loss zone. With current daily traffic at only 80, operators must ask: how to break through this line by raising average ticket size, reducing food cost ratio, or increasing table turnover rate.
Sensitivity Analysis: Leverage Effect of Key Variables on Profit
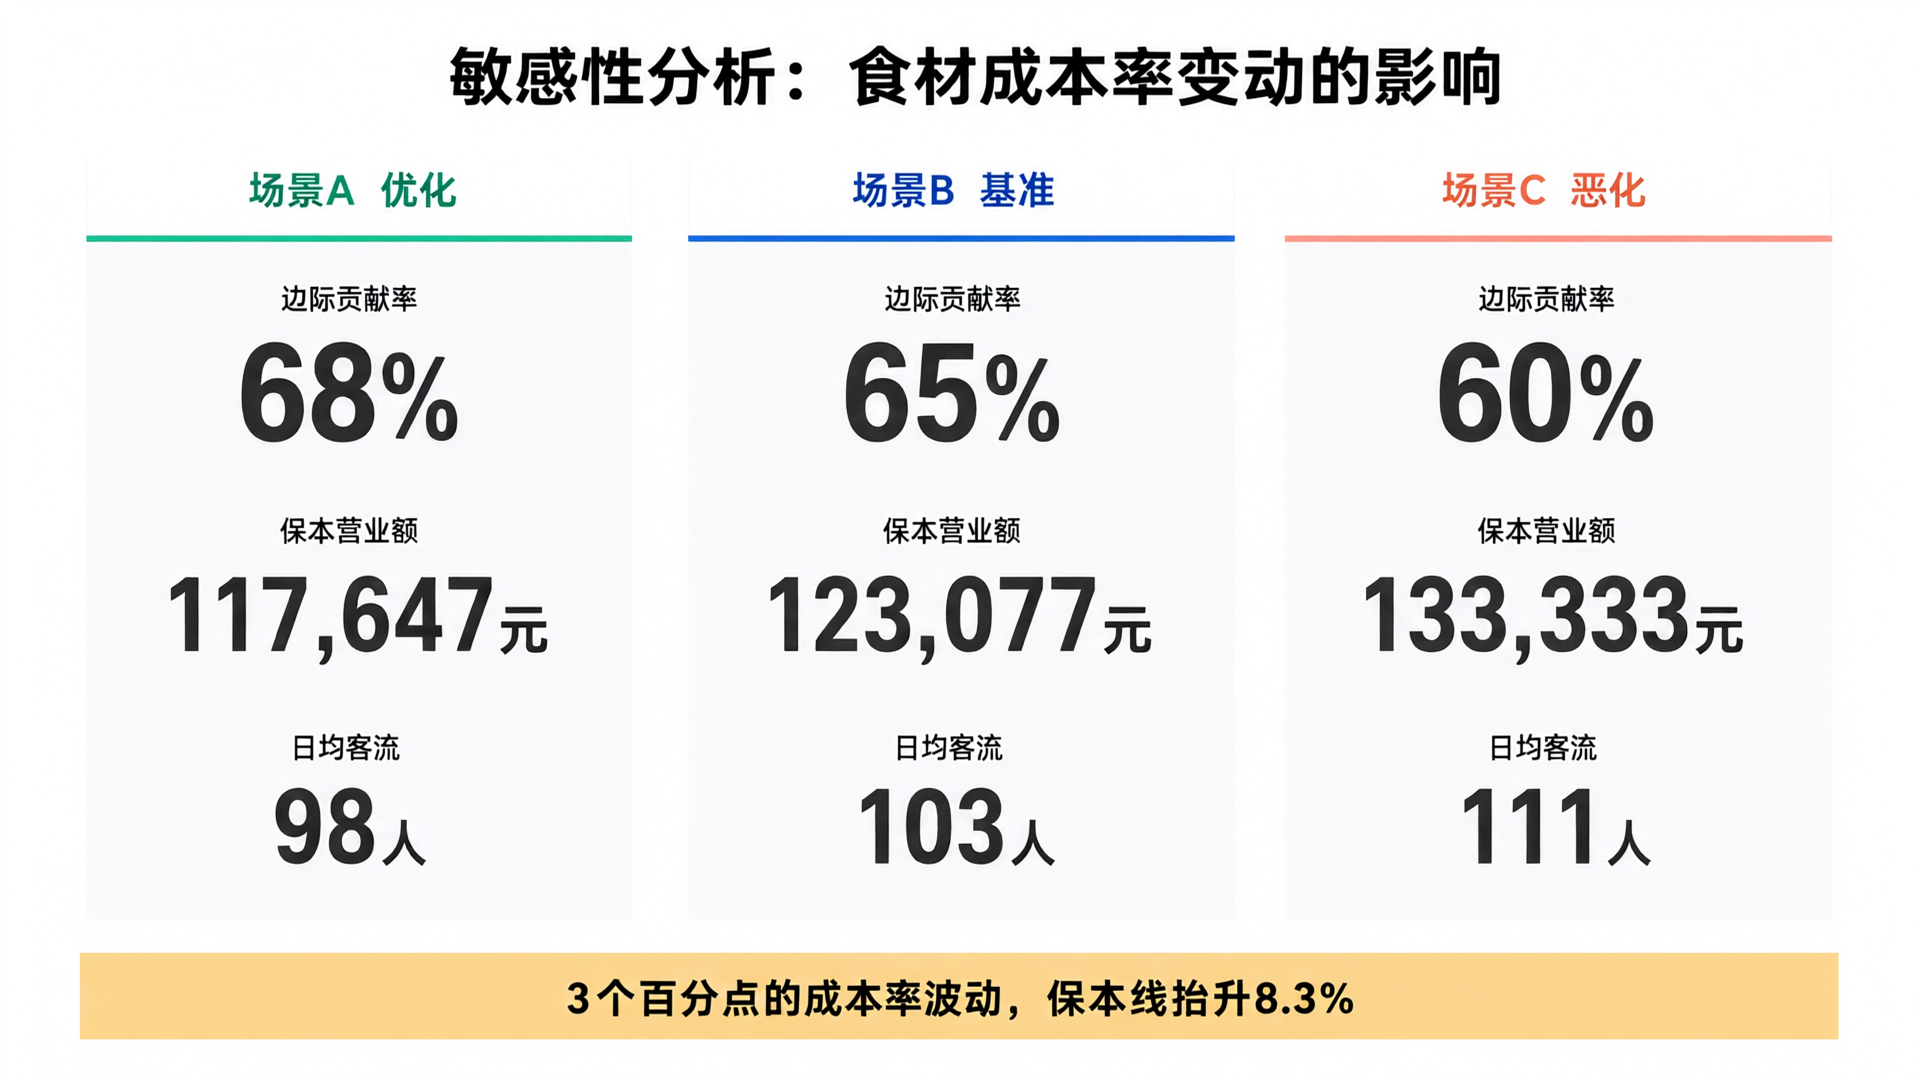
Business conditions are never static. Fluctuations in ingredient costs, rent adjustments, and changes in average check size all shift the break-even point. For instance, if the ingredient cost ratio rises from 35% to 40%, reducing the contribution margin to 60%, the new break-even revenue becomes 80,000 ÷ 0.6 ≈ 133,333 per month—an increase of approximately 10,256. A mere 3 percentage-point shift in cost ratio can raise the break-even line by 8.3%, creating significant pressure for restaurants that already operate on thin margins.
Conversely, if supply chain optimization reduces food cost to 32% and boosts contribution margin to 68%, the break-even revenue drops to approximately 117,647 per month, requiring service of only 98 customers daily. A 5-percentage-point improvement creates a buffer of 5 additional customers per day. This demonstrates that under fixed costs, even minor changes in variable cost ratios can have a significant leverage effect on profit. Precise management of food procurement isn't just an enhancement—it's a core action directly tied to operational safety margins.
Margin of Safety and Operational Decisions
The break-even point is just the starting line. Operators must also monitor the margin of safety—the difference between actual or projected revenue and break-even revenue. Margin of Safety = (Actual Revenue – Break-even Revenue) ÷ Actual Revenue. A margin of safety above 20% indicates a healthy buffer against risk; below 10%, even minor fluctuations in performance could lead to losses. Prepare cost-reduction plans or adjust pricing strategies proactively.
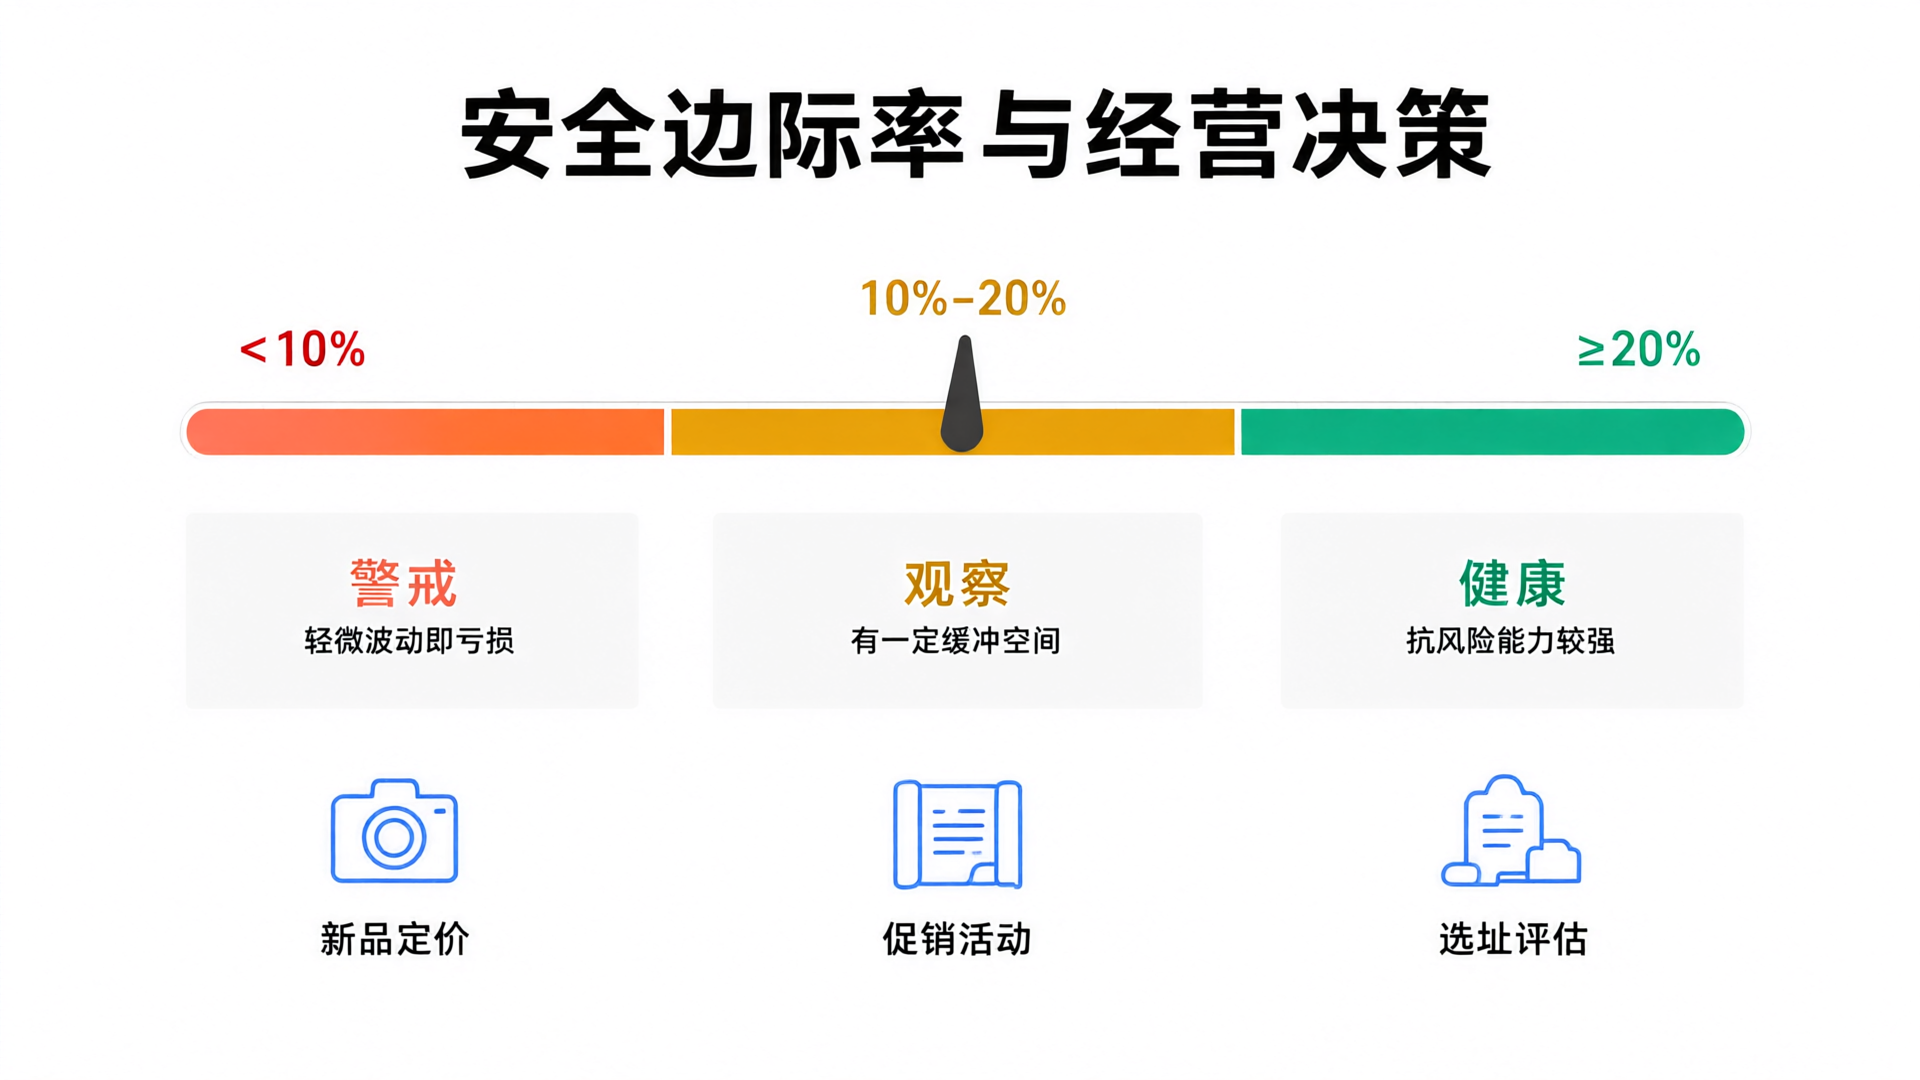
The CVP framework goes beyond post-event analysis. When pricing new products, you can calculate break-even volumes at different price points to assess whether market demand is sufficient. During promotions, compute the relationship between discount levels and the break-even point to avoid "selling more but losing money." For new store site selection, use required break-even traffic to reverse-engineer footfall capacity in a trade area, providing quantitative data for investment decisions. Hongzhu Management Accounting's CVP tools allow online input of cost structures and pricing parameters, automatically calculating break-even points and safety margins to help operators complete such quantitative analyses quickly.
The value of Cost-Volume-Profit (CVP) analysis lies in transforming "gut feelings about business performance" into "precise knowledge of the break-even point." The logical relationship among four variables—fixed costs, variable costs, average order value, and sales volume—is deterministic. Mastering this framework gives restaurant operators a quantifiable, verifiable foundation for decision-making when adjusting prices, managing cost fluctuations, or planning expansion.